Today, Bitcoin has breached the target price of $30,000.
The bullish momentum extended to the high of $33,200 but was repelled. The biggest altcoin has broken the current resistance as bulls attempt to break the historical price level of April 2018. BCH and XRP are yet to resume upside momentum.
BTC/USD Major Trend: Bullish
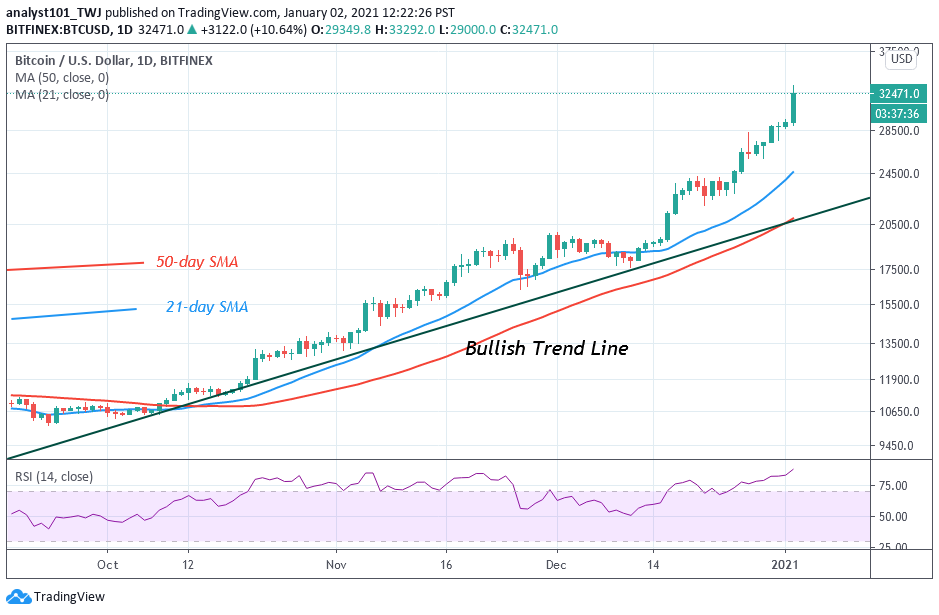
In the previous week, Bitcoin rallied to $28,000 high after the bulls broke the resistance at $24,000. The bulls were not able to break the $28,000 high, not until after three days of correction. In this week, the resistance at $28,000 was broken as the BTC tested the $30,000 resistance and pulled back. Today, the price pulled back to $29,600 low and rebounded to break the $30,000. The bulls have not only broken the $30,000 resistance but BTC is trading at $31,892 at the time of writing.
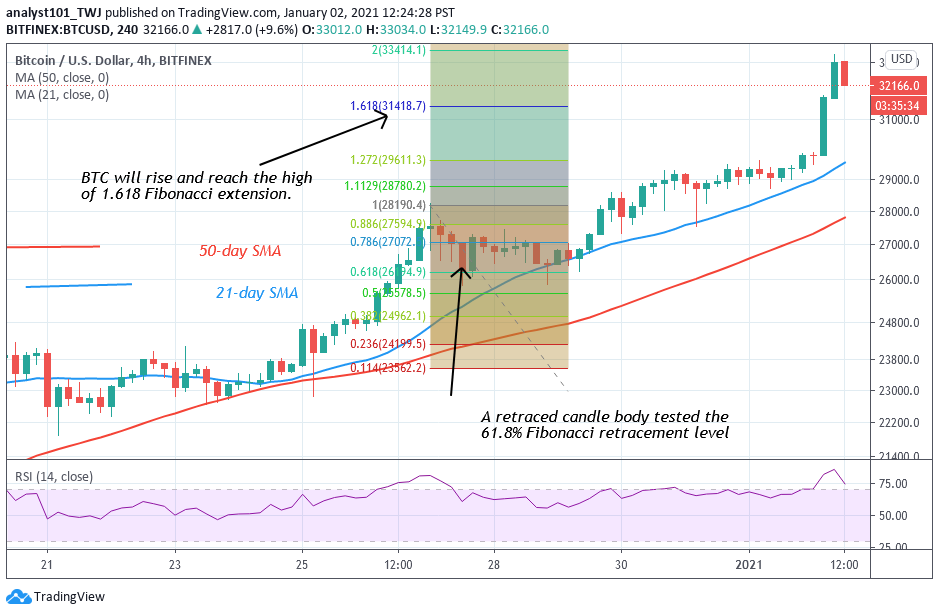
Today, the price action has confirmed the accuracy of the Fibonacci tool analysis. On December 26 uptrend; a retraced candle body tested the 61.8% Fibonacci retracement level. The retracement indicates that BTC price is likely to rise to level 1.618 Fibonacci extension. That is, the coin will reach a high of $31,418.80. Today, the price action has surpassed this level. Bitcoin is expected to attain a new price level on the upside.
ETH/USD Major Trend: Bullish
For the past week, Ether broke the $660 resistance and rallied to $757 high. The upward move was stalled below the recent high. The biggest altcoin resumed a sideways move for over a week for failing to break the resistance at $757. Today, Ether has broken the resistance as the market rises to reach the $800 high. If the market rallies above $800, the crypto will be breaking its previous price level of April 2018.
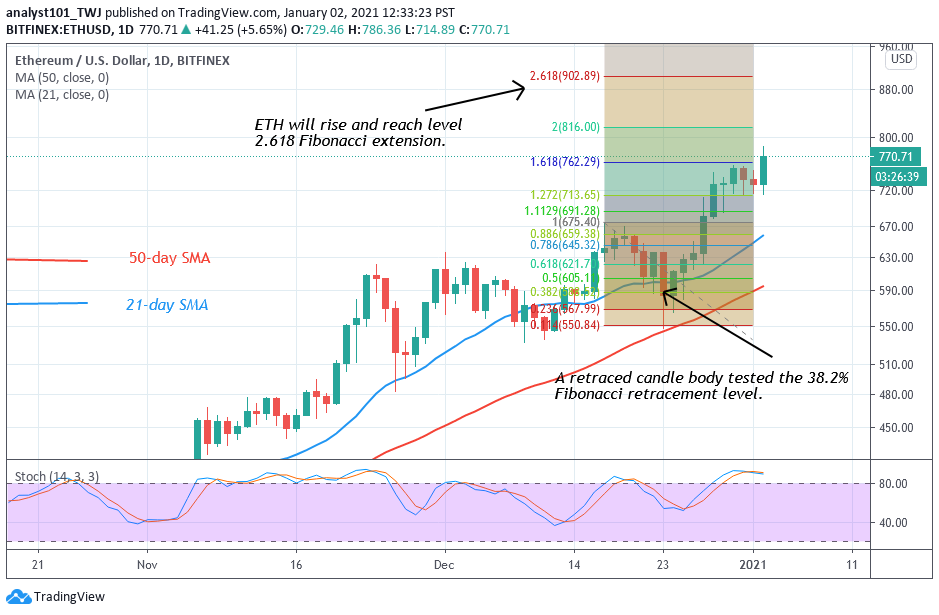
Meanwhile, the Fibonacci tool has indicated a further upward move of Ethereum. On December 19 uptrend; a retraced candle body tested the 38.2%% Fibonacci retracement level. This retracement gives the impression that ETH will rise and reach level 2.618 Fibonacci extensions. In other words, Ethereum will reach a high of $902.89 in the coming days.
XRP /USD Major Trend: Bearish
Ripple has been making a downward move consistently. For the past week, XRP has a breakdown as the coin fell to $0.18 low. On January 1, XRP made an upward move to $0.25 which was resisted. This resistance indicates a further downward movement of the coin. Ripple downward move is a result of a fundamental issue. XRP’s token attained a market capitalization of roughly $140 billion in 2018. Today, market capitalization has declined to $10 billion which gives an estimated loss of $130 billion.
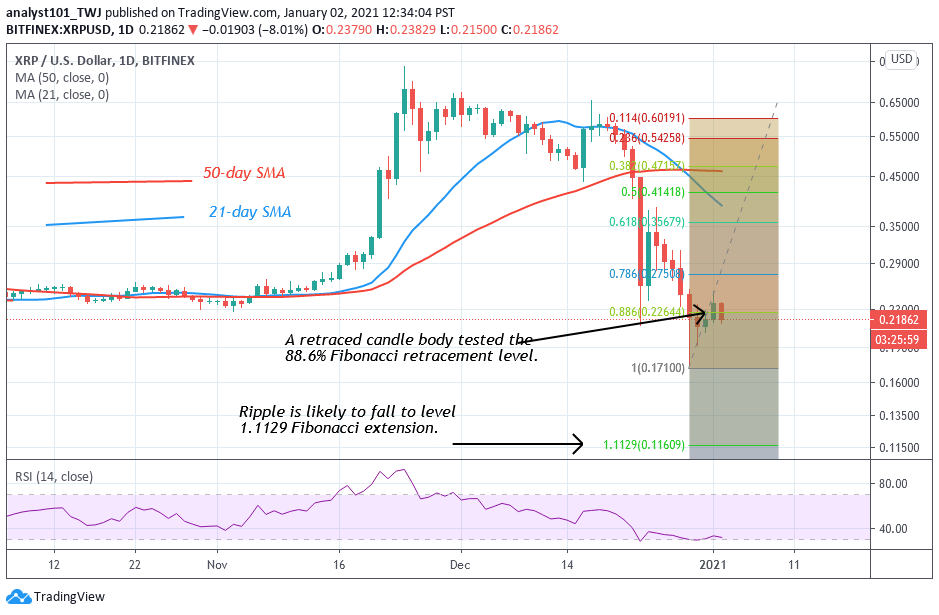
Meanwhile, on December 29, XRP corrected upward which was repelled. The retraced candle body tested the 88.6 % Fibonacci retracement level. The retracement implies that Ripple will fall to level 1.1189 Fibonacci extension or $0.11609 low. At this price level, the market will reach bearish exhaustion.
BCH /USD Major Trend: Bullish
Last week, BCH price was making an upward move to retest the $380 overhead resistance which was resisted on December 28. For past the month, BCH has been range-bound between $250 and $380 price levels. Neither the bears nor the bulls have broken the range-bound levels. On the upside, if the bulls break the $380 overhead resistance, BCH will resume an upward move. The market will rise to $430 high and later above $500. However, if the bullish scenario fails, the altcoin will continue its range bound movement between $250 and $380 price levels.
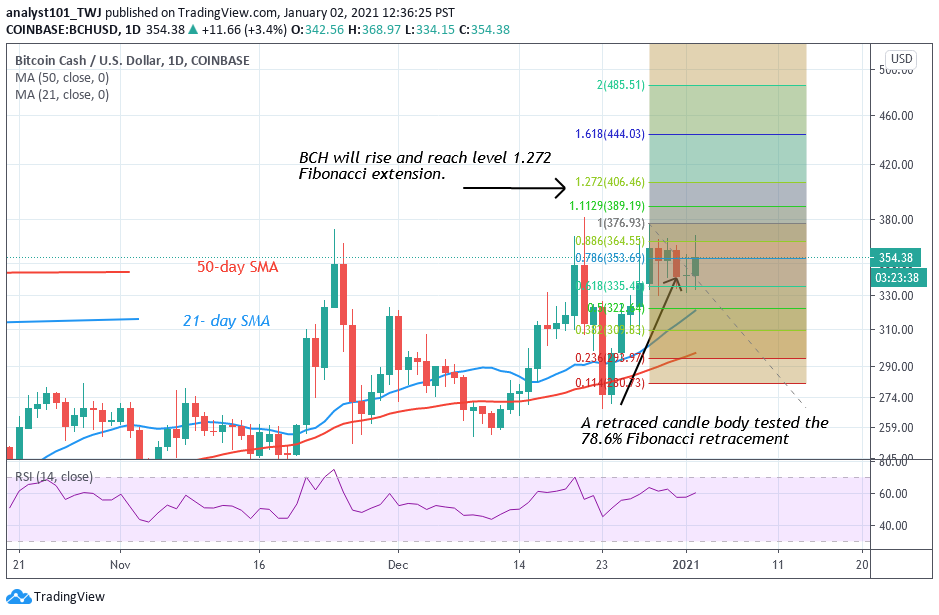
According to the Fibonacci tool, there is a possibility of a further upward move . On December 28 uptrend; the retraced candle body tested the 78.6% Fibonacci retracement level. The retracement indicates that BCH is likely to rise to level 1.272 Fibonacci extensions. In other words, BCH will rise to a high of $406.46. At that price level, the market will tend to reverse to the 78.6% Fibonacci retracement level where it originated.

