For the past week, Bitcoin (BTC) price has been in upside momentum up till November 5. Ethereum and the other altcoins were struggling to rise in a downward correction. Nonetheless, on November 4, the cryptos have all resumed upside momentum.
BTC/USD Major Trend: Bullish
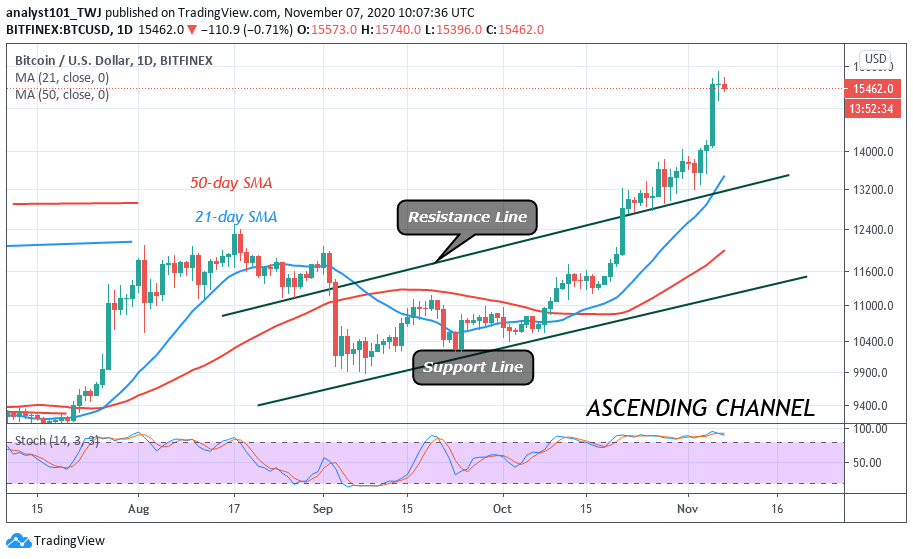
In the previous week, Bitcoin has been in upside momentum. The price surge reached a high of $14,000 but was resisted. Buyers retested the resistance twice on November 3 and 4 before the $14,000 resistance was breached. BTC encountered an accelerated price movement as the coin rallied above $15,000. This week there is a likelihood of a further upward movement of the coin as it consolidates above the $15,000 support. Yesterday, BTC reached a high of $15,888 but retraced to $15,400. Presently, the king coin is fluctuating between $15,400 and $15,888. A breakout at the current resistance level will propel the coin to rally above $16,000.
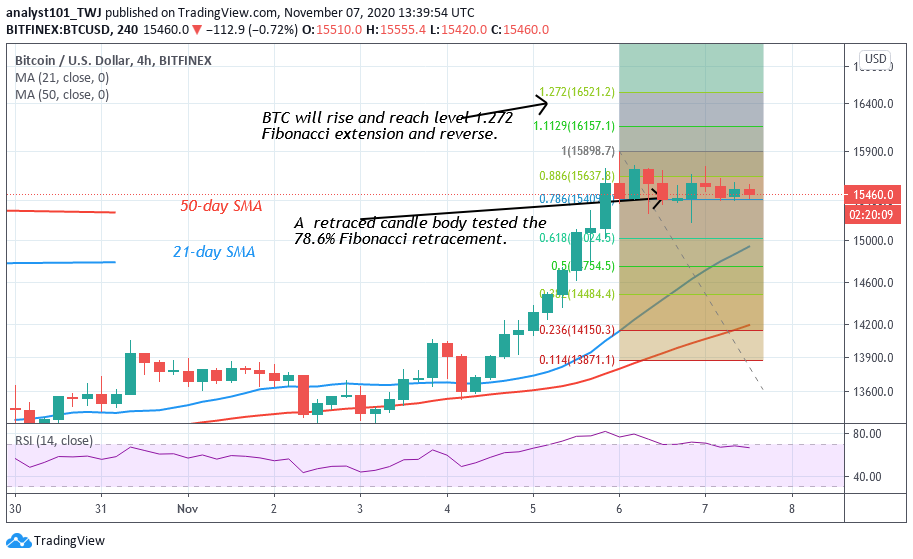
Nevertheless, on November 5 uptrend; BTC was resisted at $15,723. The retraced candle body tested the 78.6% Fibonacci retracement level. This retracement suggests that BTC will rise to a level of 1.272 Fibonacci extensions. This extension is the same as the high of $16,521.20. However, BTC is likely to reverse at the 1.272 Fibonacci extensions and returned to 78.6% retracement where it originated.
ETH/USD Major Trend: Bullish
In the previous week, Ethereum has been in a downward correction. The coin fell to $371 low after rejection from $420 high. The coin has been correcting upward to retest the initial resistance at $390 but the selling pressure pushes the coin downward. On November 4, the bulls buy the dips as the coin rebounded above $376. After the rebound, the price rallied above the $395 resistance. Later, the momentum extended above the $420 high.
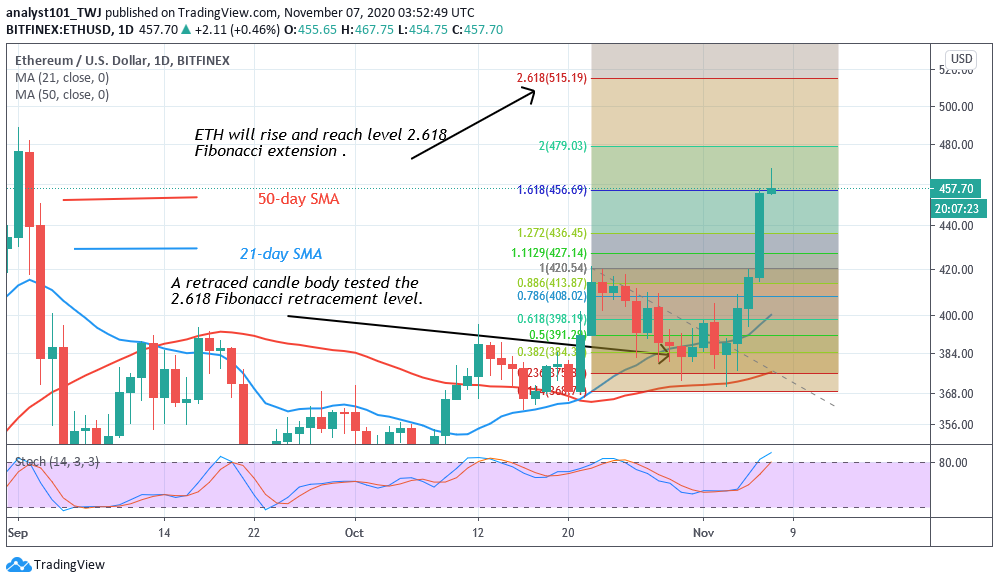
Today, ETH has risen to the $470 resistance zone but it is retracing from the recent high. The upside momentum will resume if buyers sustain a price above the $450 high. The current bullish momentum has a target price of $488 if buyers sustain the uptrend. On October 22 uptrend; the coin was resisted at the $420 high. The retraced candle body tested the 61.8% Fibonacci retracement level. This indicates that Ethereum will continue the upward move to level 2.618 Fibonacci extension. This is the same extension as $515.19 high.
XRP /USD Major Trend: Bullish
Today, Ripple has a bullish run to a high of $0.267. Incidentally, this was not the case in the previous week as the coin plunged to a $0.227 low. Before the period of a downward movement of the coin, Ripple has been in a range-bound movement between $0.23 and $0.26. The recent price action was a bullish reaction at a low of $0.227. The bulls buy the dips as the coin continues its upside momentum.
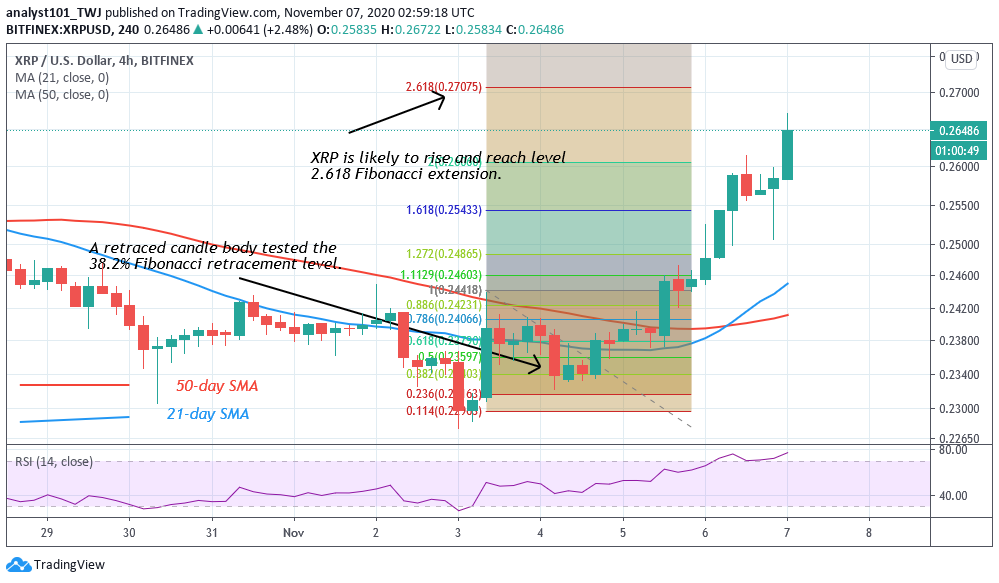
Yesterday, buyers continued to push XRP to the previous highs as it retested the $0.26 resistance. Sellers pushed the coin to the $0.252 low but buyers recouped and broke the $0.26 resistance level. Today, XRP reached a high of $0.267 but it is retracing to the previous support at $0.26. On the upside, if the bulls fail to sustain the momentum, XRP will fall back to the previous range of $0.23 to $0.26. However, from the indicator reading the coin has another chance of upside momentum. On November 3 uptrend; a retraced candle body tested the 38.2% Fibonacci retracement. This retracement implies that the coin will reach a high of 2.618 Fibonacci extensions or the high of $0.2705.
BCH /USD Major Trend: Bullish
For the past week, buyers have been making a concerted effort to break the resistance at $280. The bulls have made three attempts at the resistance. In the last attempt, BCH encountered a bearish reaction that plunged the coin to a low at $232. On November 4, the bulls bought the dips as the coin rallied to a $275 high.
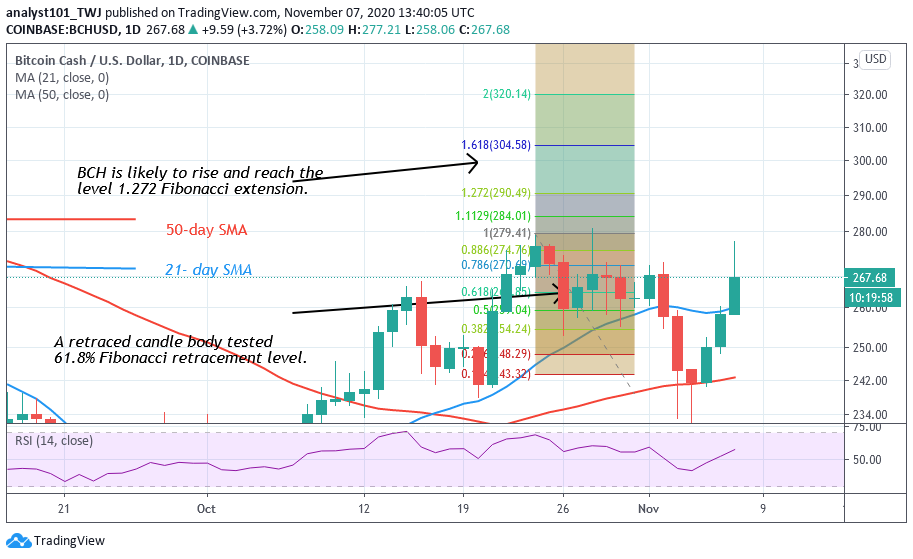
On the upside, if buyers can push BCH above the $280 resistance, the coin is likely to rise to a $320 high. On the other hand, a strong bounce above the current support will propel the price to break the $280 high. Nonetheless, if the bulls fail to break this resistance level, the coin will continue the sideways move below it. From the daily Chart, on October 24 uptrend the coin was resisted at $280. A retraced candle body tested the 61.8 Fibonacci extension level. It indicates that the coin will rise and reach a level of 1.618 Fibonacci extensions. That is the high of $304.58.

