The largest cryptocurrency has recovered from the previous decline as bulls attempt to break the crucial resistance at $48,000. The other cryptos including XRP, DOT, LTC, and LINK are making attempts to break their respective resistance levels. A break above the next resistance will propel the altcoins to resume upside momentum.
BTC/USD Major Trend: Bullish
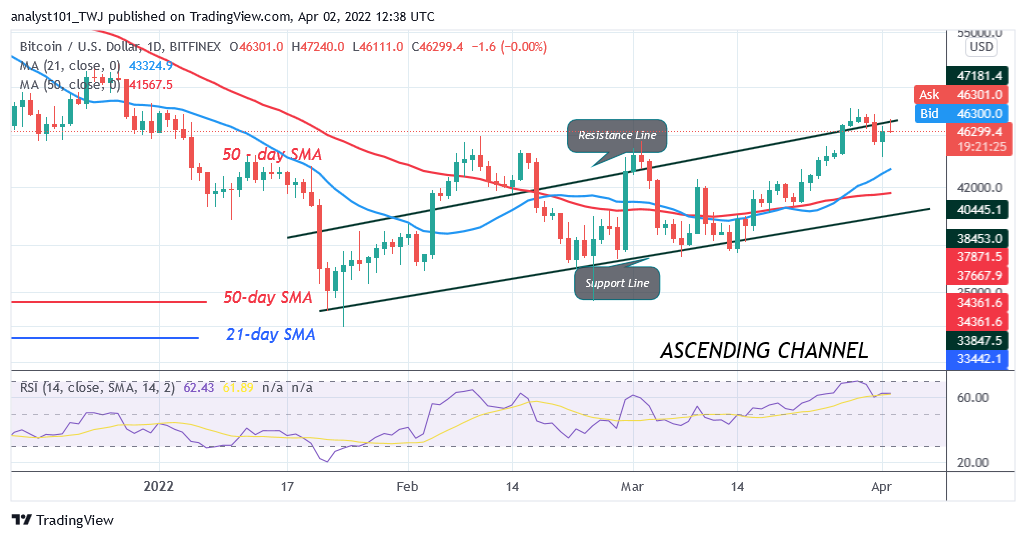
Bitcoin’s (BTC) price is trading above the moving averages as bulls fail to break the resistance at $48,000.The largest cryptocurrency has retraced to the low of $45,190 and resumed a sideways move. The crypto is now fluctuating between $45,400 and $48,000 price levels. The$45,400 was the previous resistance level but is now a support level. The downtrend will resume if the support is breached and the bearish momentum is sustained.
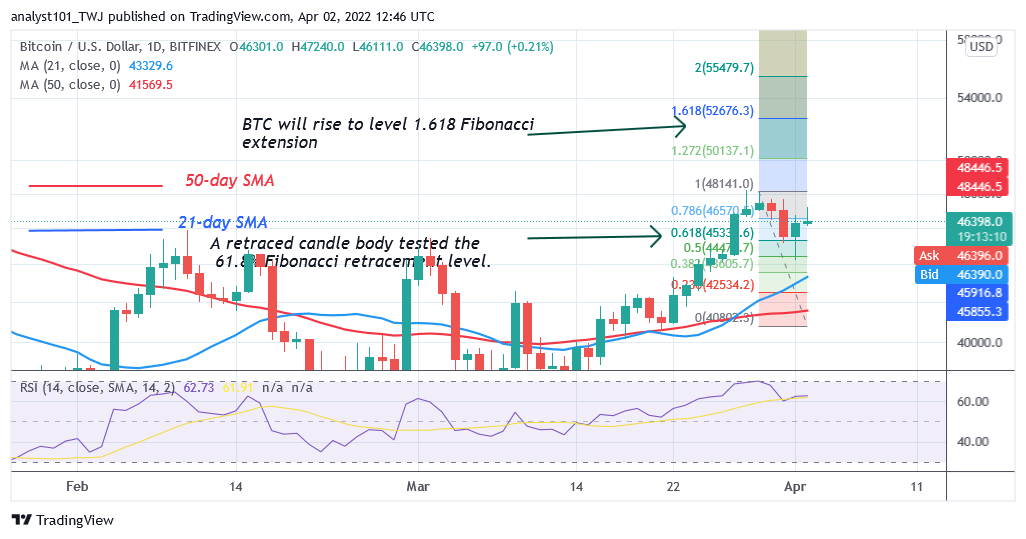
Conversely, if the current resistance is breached, Bitcoin will resume upside momentum. The market will rise above $52,000 high. Meanwhile, on March 28 uptrend; a retraced candle body tested the 61.8% Fibonacci retracement level. The retracement suggests that the BTC price will rise to level 1.618 Fibonacci extension or $52,676.30. In the meantime, BTC/USD is trading at $45,893 as of press time.
XRP/USD Major Trend: Bullish
Ripple’s (XRP) price is declining as it faces rejection at the $0.90 resistance. This will be the second time; XRP is facing rejection at the recent high. On February 9, the altcoin was repelled at the $0.90 resistance as XRP fell to $0.62 low. Buyers pushed the crypto above the moving averages to retest the recent high.
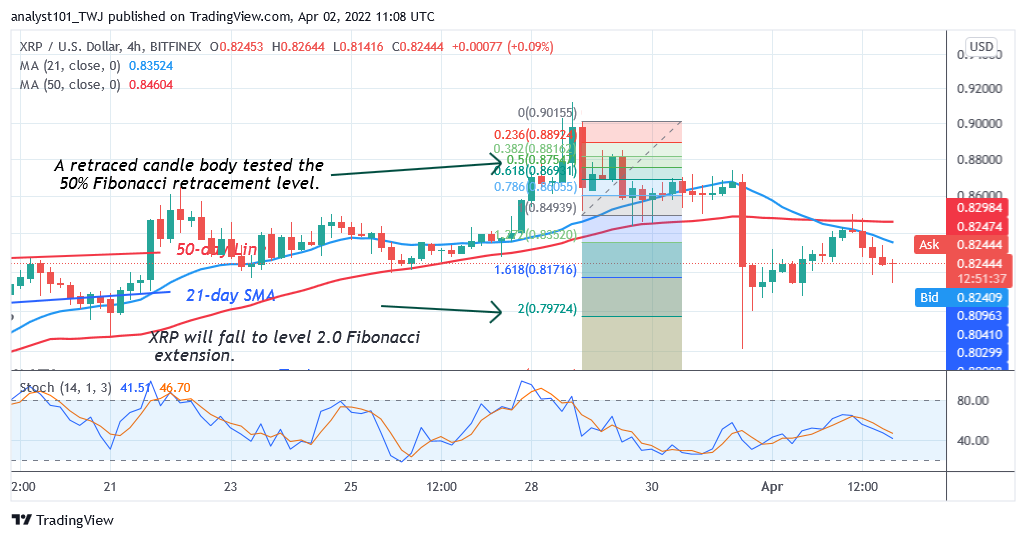
XRP/USD has declined above the moving averages indicating that the selling pressure has subsided. Meanwhile, on March 28 downtrend; a retraced candle body tested the 50% Fibonacci retracement level. The retracement indicates that XRP will fall to level 2.0 Fibonacci extension or $0.79. From the price action, XRP/USD has reversed as the altcoin retested level 1.618 Fibonacci extension and resumed upward. The current uptrend is facing rejection at $0. 85
DOT/USD Major Trend: Bullish
Polkadot’s (DOT) price is trading in the bullish trend zone as buyers attempt to break above the $23 resistance level. Since March 27, the bulls are yet to break above the recent high as the market reached the overbought region.
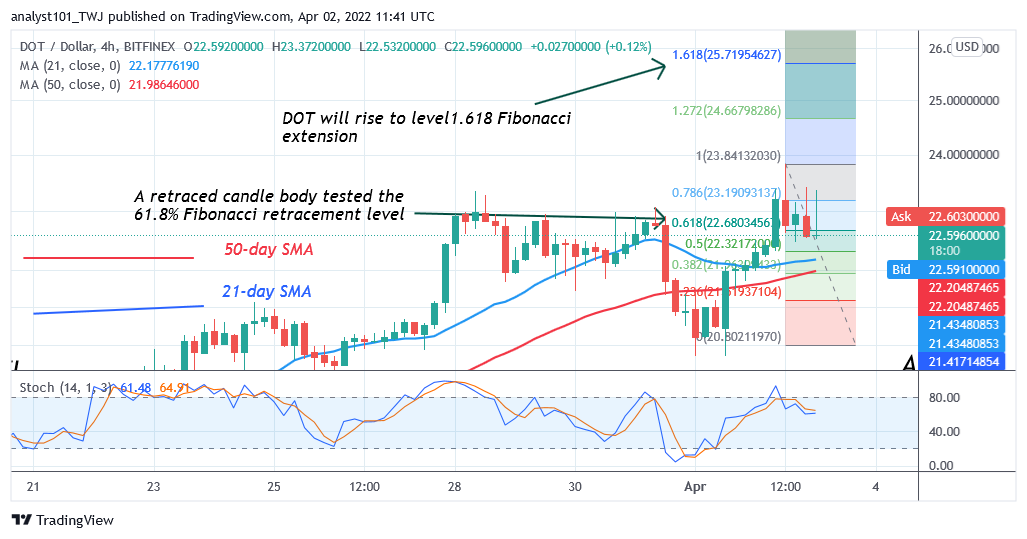
DOT/USD risks possible decline. However, the altcoin will rally to $28, if the current resistance is breached. Meanwhile, on April 2 uptrend; a retraced candle body tested the 61.8% Fibonacci retracement level. The retracement suggests that DOT will rise to level 1.618 Fibonacci extension or $25.71. From the price action, the bulls are yet to break the resistance t $23.
LTC /USD Major Trend: Bullish
Litecoin’s (LTC) price is in the bullish trend zone as the altcoin faces rejection at the $132 high. The altcoin retraced to the $121 low and resumed consolidation above the current support.
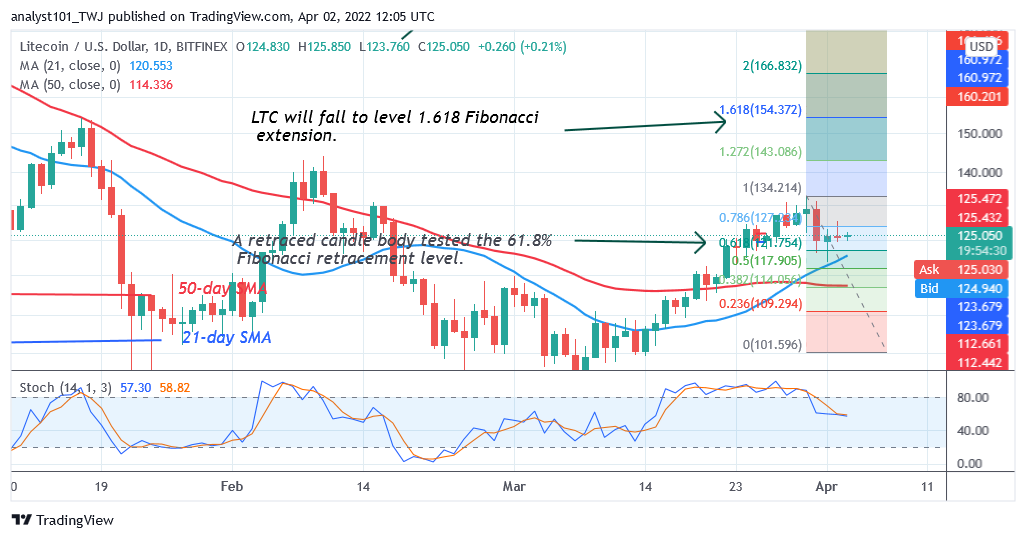
There is a possibility of further upward move as the altcoin finds support above the moving averages. On the upside, Litecoin will rally above $150 if the current resistance is breached. On March 30 uptrend; a retraced candle body tested the 61.8% Fibonacci retracement level. The retracement suggests that LTC will fall to level 1.618 Fibonacci extension or $154.37. Litecoin is trading at $125.43 at the time of writing.
LINK /USD Major Trend: Bullish
Chainlink’s (LINK) price has broken above the moving averages as the altcoin reaches the high of $17.60. The bulls have broken above the $17 high and it is approaching the resistance at $19. On the upside, a break above the resistance at $19 will catapult Chainlink to $28 high.
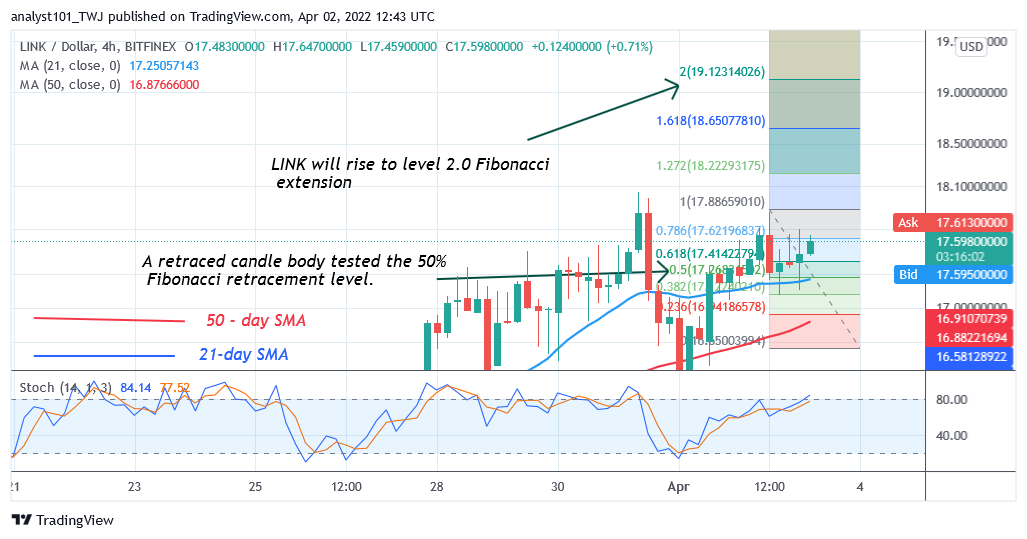
However, the current uptrend may face rejection as the market reaches the overbought region.Chainlink will fall and find support above $15 if the altcoin faces rejection at the recent high.. LINK/USD will resume a range-bound move between $15 and $19 price levels. However, if the bears break below the $15 support or below the moving averages, the downtrend will resume. Meanwhile, on April 2 uptrend; a retraced candle body tested the 50% Fibonacci retracement level. The retracement indicates that LINK will rise to level 2.0 Fibonacci extension or level $19.12.

