
Bitcoin and the other cryptocurrencies are still struggling below the moving averages. XRP appears to trade above the moving averages but risks further decline. This week, the cryptocurrencies may further decline if it faces rejection at the moving averages. On the other hand, a price rebound will catapult the cryptos above the moving averages.
BTC/USD Major Trend: Bearish
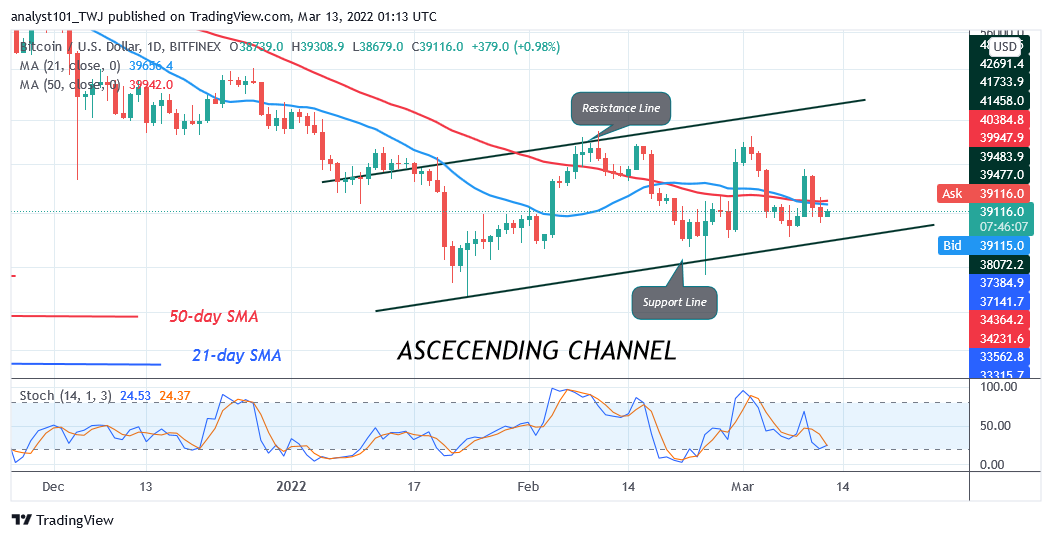
Bitcoin’s (BTC) price is in a downward correction as price breaks below the moving averages. BTC prices is fluctuating between $38,200 and $40,200 price levels as buyers attempt to push Bitcoin above the moving averages. Since February 4, buyers have pushed Bitcoin above the moving averages on three occasions but were repelled. Nevertheless, a break above the moving averages will propel Bitcoin above the $42,000 high. Bitcoin will rise to revisit the $45,000 overhead resistance if the bullish momentum is sustained.
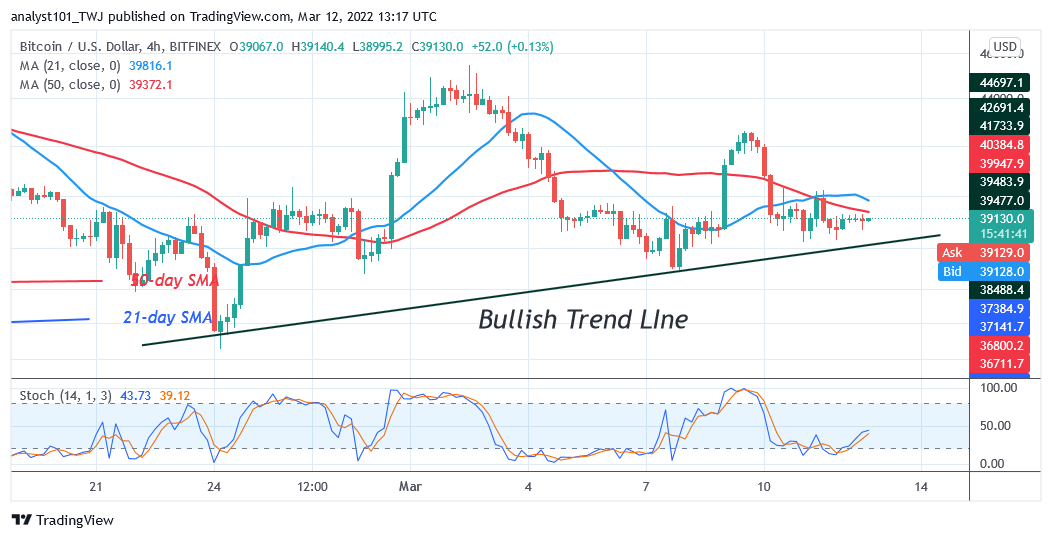
Conversely, if BTC’s price faces rejection at the moving averages, the market will decline to the low of $37,000. Nonetheless, the market will further decline to the low of $36,000 or $34,000 if Bitcoin loses the $37,000 support. Bitcoin is at level 48 of the Relative Strength Index for period 14. It indicates that the cryptocurrency is in the downtrend zone and capable of falling to the downside.
XRP/USD Major Trend: Bullish
Ripple’s (XRP) price is trading in the bullish trend zone as price breaks above the moving averages. The upward move is hampered at the resistance of $0.80.
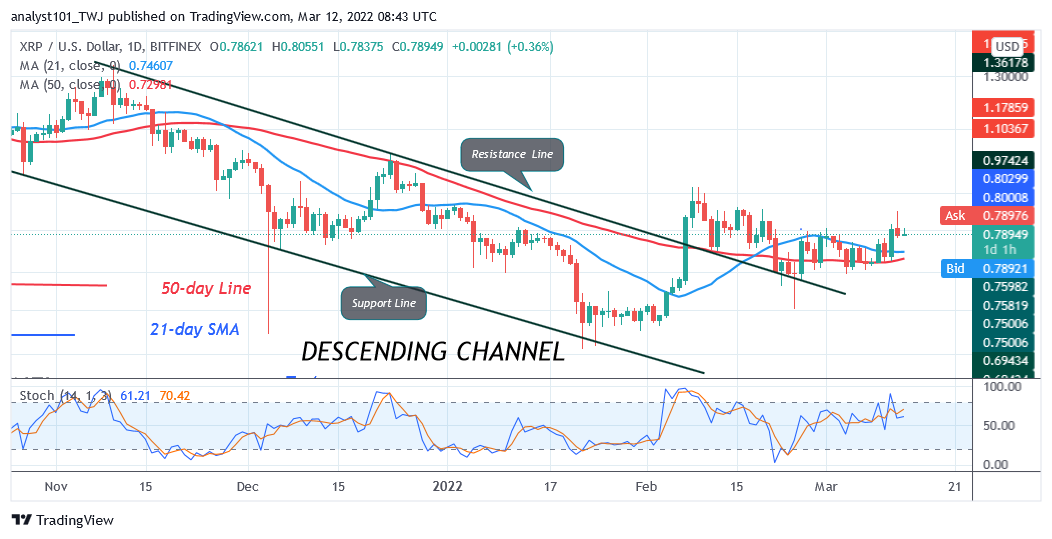
On the upside, if the bulls break above the $0.80 resistance, XRP will rally above the $0.90 high. The bullish momentum is likely to continue to the next resistance at $1.00. Today, XRP has declined and is found above the low of $0.78. A retest at the $0.80 resistance is possible. Nonetheless, if XRP turns from the $0.80 resistance and breaks below the moving average, XRP/USD will resume a downtrend. The market will decline to a low of $0.69 low.
DOT/USD Major Trend: Bearish
Polkadot’s (DOT) price is in a downward correction but buyers have pushed DOT price above the 21-day line moving average. The upward move is facing resistance at the 50-day line moving average. The implication is that Polkadot is likely to be range-bound between the moving averages.
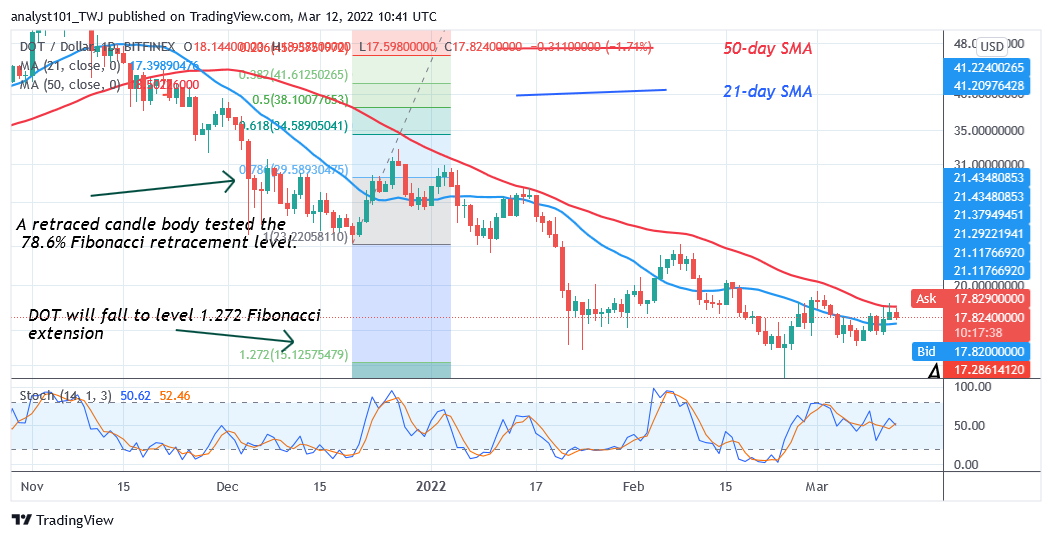
The market will trend when the moving average lines are breached. For instance, if price breaks below the 21-day line moving average, the DOT price will decline to $15 low. Meanwhile, on December 20 downtrend, a retraced candle body tested the 78.6% Fibonacci retracement level. The retracement suggests that DOT price will fall but reverse at level 1.272 Fibonacci extension or $15.12. From the price action, DOT price has retested and reversed above level 1.272 Fibonacci extension on three occasions.
LTC /USD Major Trend: Bearish
Litecoin’s (LTC) price is in a downward correction as price faces rejection at the moving averages. Since January 22 price slump, LTC/USD has been trading between $96 and $140 price levels. The bulls broke above the moving averages but faces rejection at the $150 and $140 price levels.
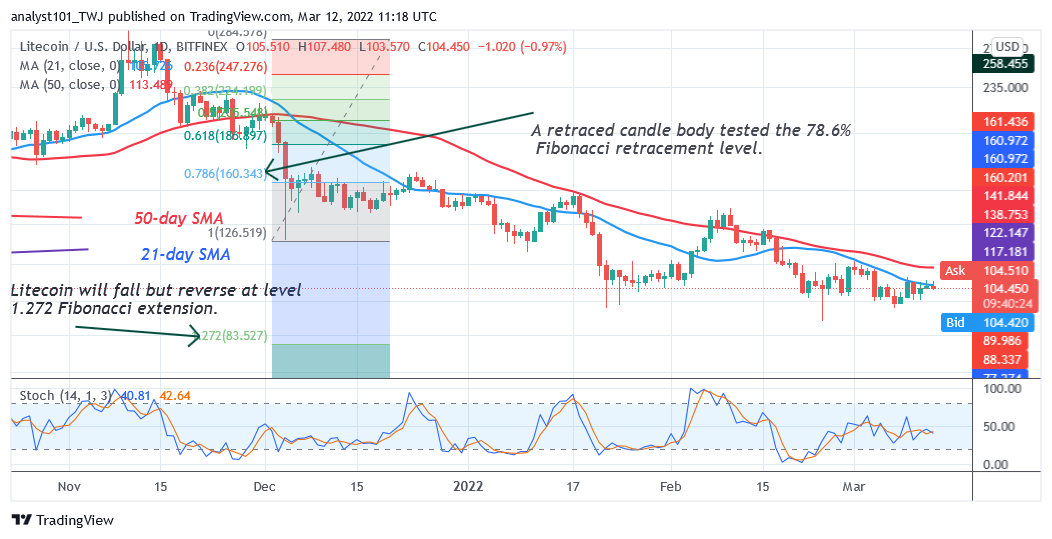
The cryptocurrency risks further decline if it faces rejection at the moving averages. On the upside, if the bulls break above the moving averages, a retest at the $140 high is possible. On the downside, a break below the current support will push the altcoin to $91 low. Meanwhile, on December 4 downtrend; a retraced candle body tested the 78.6% Fibonacci retracement level. The retracement suggests that LTC will fall to level 1.272 Fibonacci extension or $83.52.
LINK /USD Major Trend: Bearish
Chainlink’s (LINK) price is in a downward correction but faces rejection at the moving averages. On March 10, Chainlink faced rejection at the 21-day line moving average and it fell above the $13 support. Since January 24, LINK/USD has been holding above the $13 support.
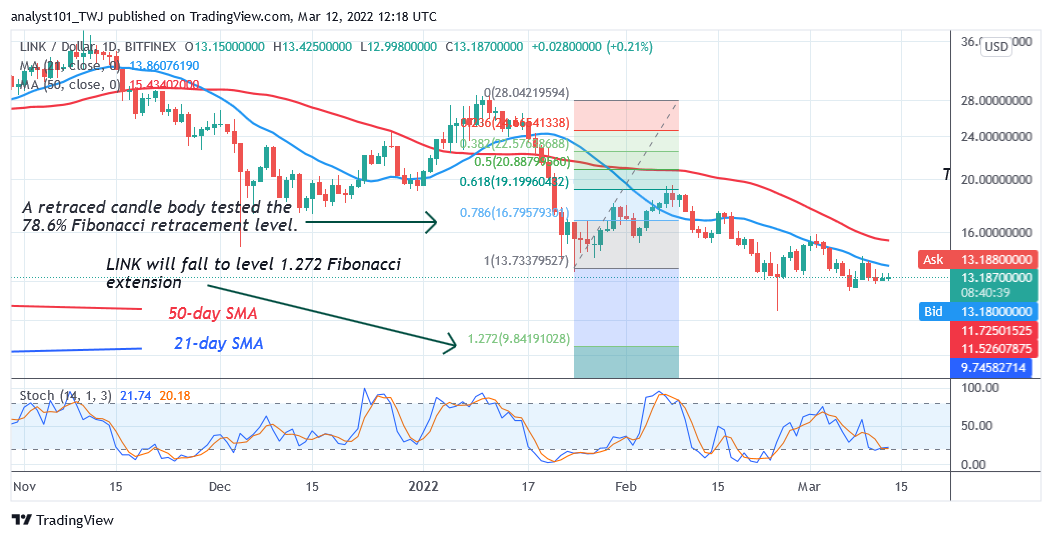
The altcoin has been trading in a tight range between $13 and $19 price levels. Chainlink will further decline to $11 or $9 if the bears break the current support. Meanwhile, on February 24 downtrend; a retraced candle body tested the 78.6% Fibonacci retracement level. The retracement suggests that LINK will fall to level 1.272 Fibonacci extension or $9.84


