
Bit Coin 4-Hour Price Prediction 2020
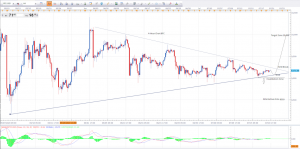
The Bitcoin (BTC) in an uptrend and currently moving between 10100 to 9050 zone and forming a symmetric triangle in 4-Hour chart.
The symmetric triangle forming in an uptrend is the earliest signal for bullish continuation pattern but we have to check the confirmation of break.
The current market price is 9170 and the narrow down final support of the Symmetric triangle is around 9060-70.
We are expecting a bounce from 9070 towards the resistance at 9250.
As the symmetric triangle is becoming and narrow and most probably it will break in the next wave and could take bitcoin towards minimum target 10100. The break & closing above9250 will confirm this move. ( We will consider the break confirmation after closing 4-hour candle )
Alternative: If the price moves lower and close below the support level of the symmetric triangle, then the bullish pattern will invalidate and we will look for the bearish target which is 8510 and the confirmation of break price is 9000. We only consider the break if the price moves lower and close below 9000 in the 4-hour chart.
Support & Resistance Level
Main Predictions
Immediate Resistance: 9230
Resistance Break Confirmation: 9250
Target After Break: 10100
Alternative Targets
Immediate Support: 9074
Support Break Confirmation: 9000
Target After Break: 8510
Support & Resistance Level
Main Predictions
Immediate Resistance: 9230
Resistance Break Confirmation: 9250
Target After Break: 10100
Alternative Targets
Immediate Support: 9074
Support Break Confirmation: 9000
Target After Break: 8510


