 In the previous week, the coins faced selling pressure as the market reached the previous lows. This week, the cryptocurrency markets have taken a breath as the market reached consolidation. Bitcoin and Ethereum have made impressive moves but face resistance at the recent highs. Bitcoin is facing selling pressure at the $10,500 high. Similarly, Ether faced rejection at the $380 high. Upside momentum will resume if the resistance zones are cleared.
BTC/USD Major Trend: Bearish
Since the last bearish impulse on September 3, Bitcoin is range bound between $10,000 and $10,500. For the past week, sellers have partially broken below the $10,000 support to $9,800 low but the overwhelming buying pressure will push BTC upward. At other times, buyers have attempted to push BTC above $10,500 but faced selling pressure.
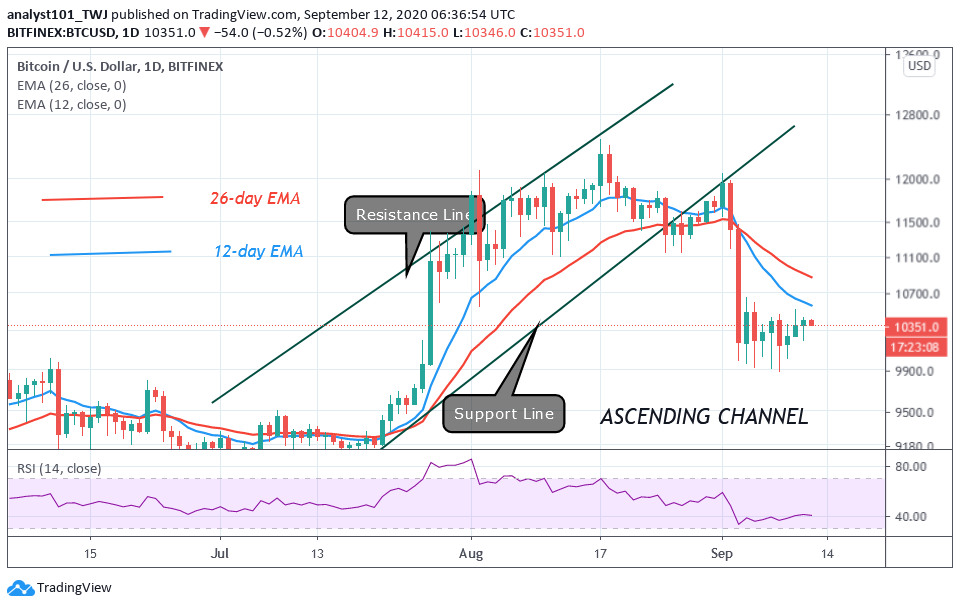
This has been the market scenario for the past week. The current situation will linger if the key levels of the market remain unbroken. For the upside momentum to resume, the bulls must break the $10,500 resistance and the momentum extends above $11,000.Failure of the bulls will mean the continuation of the downward move. On the downside, the bears have already broken below the psychological support level of $10,000 but fail to push BTC beyond $9,800.
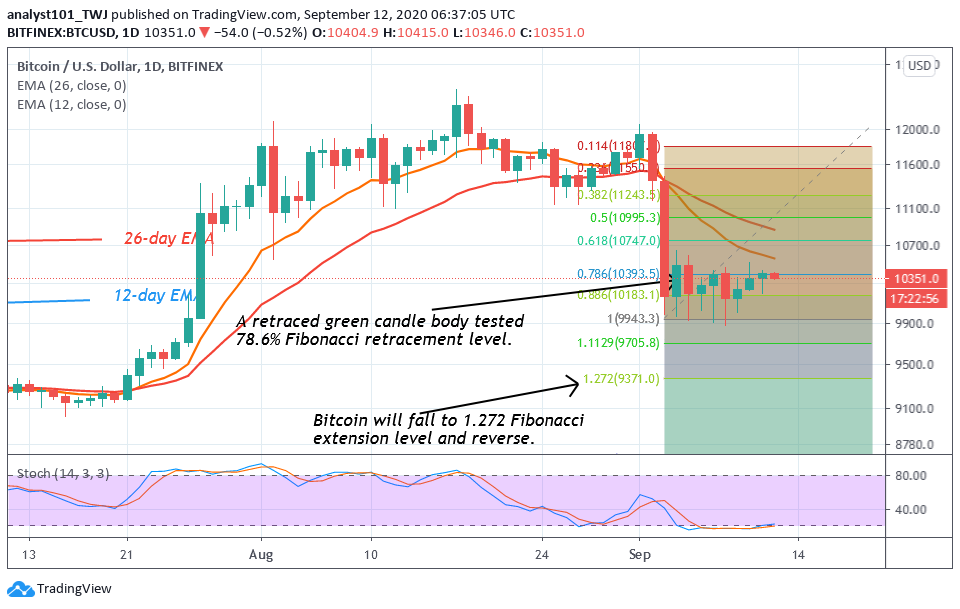
On September 3 downtrend, BTC corrected upward and the retraced candle body tested the 78.6% Fibonacci retracement level. The implication is that if the $10,000 support cracks, the crypto will fall to 1.272 Fibonacci extension level or $9,300 low. Nevertheless, the market will reverse at that level but the reversal will not be immediate.
ETH/USD Major Trend: Bearish
On September 5, Ethereum plunged to $310 low and the current support is holding. Recently, the coin rebounded at the current support and price rose to the previous highs. Nonetheless, Ether is facing resistance at the $380 high. The uptrend would have continued if the bulls had pushed ETH above the $390 support or EMAs. The price will rise and retest the $400 or $440 high.
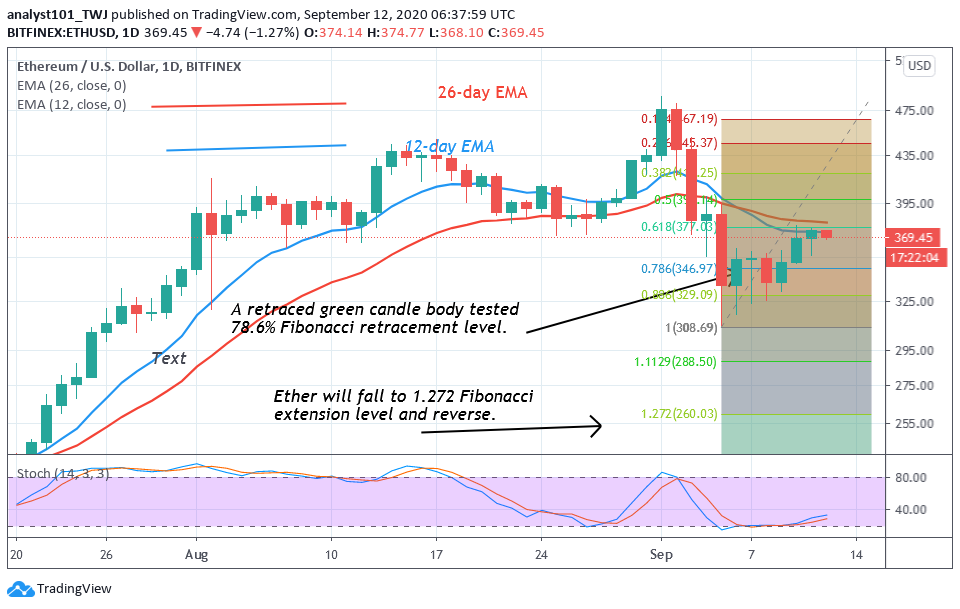
Today, ETH is falling after the resistance at $380. On the downside, the bears will attempt to break the $310 support if the selling pressure persists. In the last breakdown, the coin fell to $310, and the retraced candle body tested the 78.6% Fibonacci retracement level. This suggests that if the current support is broken, the market will fall to the 1.272 Fibonacci extension level or $260 low. Thereafter, ETH is likely to reverse at that price level.
XRP /USD Major Trend: Bearish
Ripple has been on a downward move since August 18. The coin dropped to $0.23 low from the high of $0.32 on September 5. In the last seven days, XRP has been trading above the $0.23 support. Presently, XRP is fluctuating between $0.23 and $0.25. About 48 hours ago, buyers attempted to push prices to the previous highs but were repelled at $0.25. The uptrend would have resumed if buyers pushed price above $0.28 high. However, XRP has fallen back to the price range.
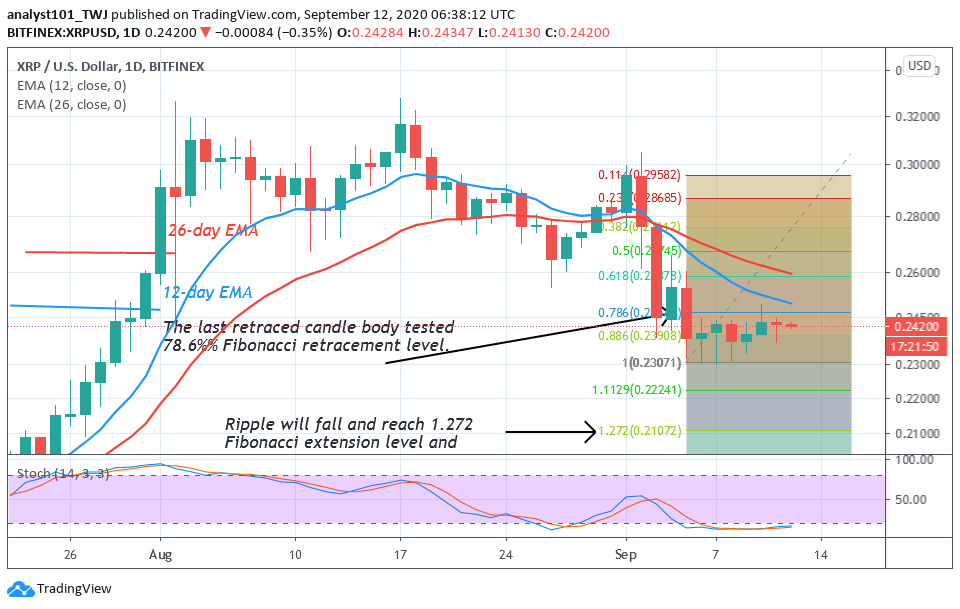
On the downside, a retraced candle body tested the 78.6% Fibonacci retracement level. Nevertheless, if the bears eventually break the $0.23 support, XRP will further decline to $0.21 low. Besides, the coin has fallen to the oversold region since September 5. It is below the 20% range of the daily stochastic and the stochastic bands are horizontally flat. It indicates that buyers are likely to emerge in the oversold region. In the meantime, XRP is range-bound above $0.23.
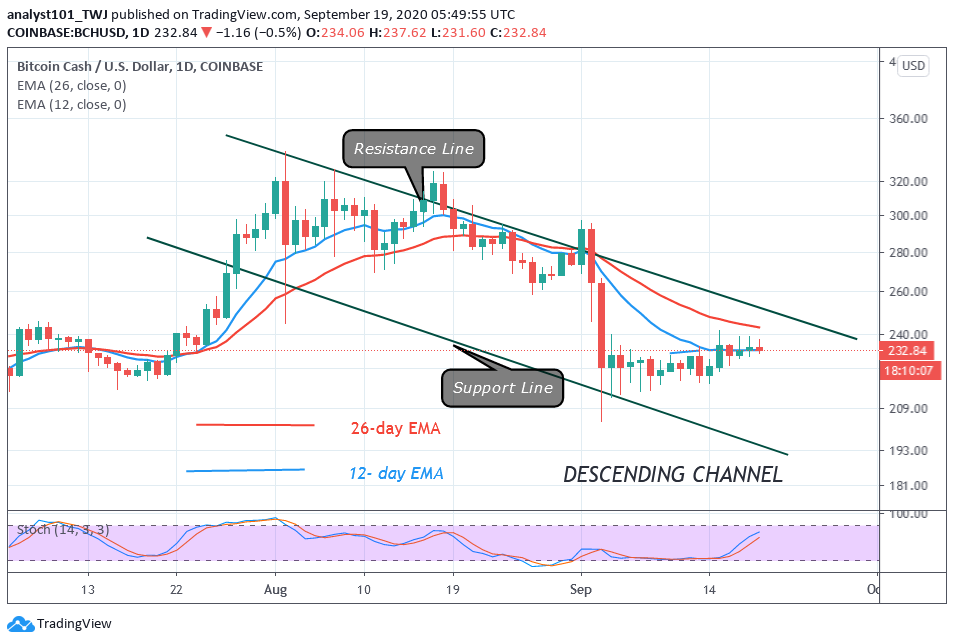
BCH /USD Major Trend: Bearish
Bitcoin Cash plunged to $203 low after the September 5 downtrend. The crypto has remained range-bound soon after the last bearish impulse. At the initial stage, price was corrected upward but buyers failed to push BCH to the previous highs.
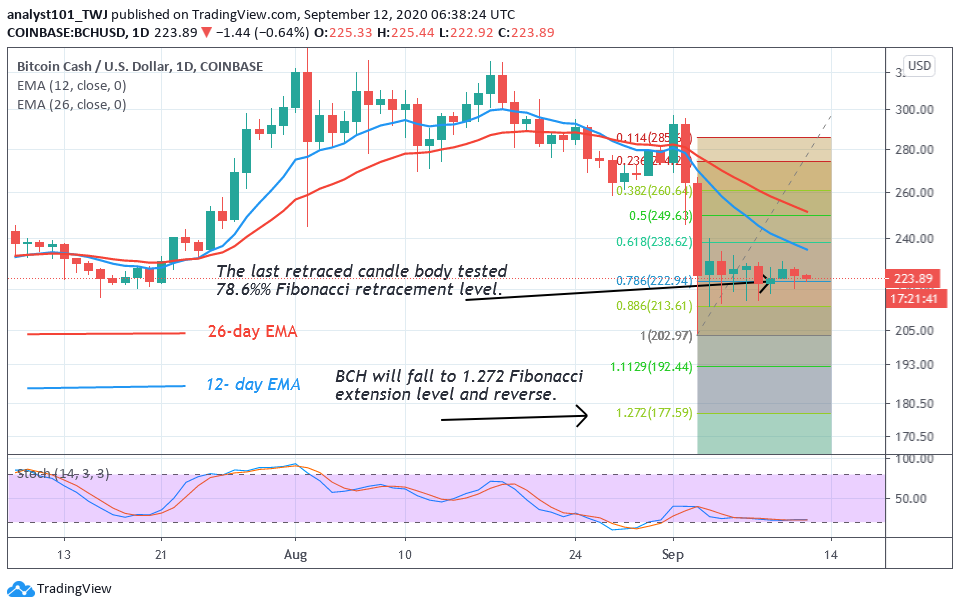
The market is now consolidating between $220 and $240. There is an indication that the market may further decline. The downward move below $200 is unlikely because the support at $200 is yet to be broken since March. However, a retraced candle body tested the 78.6% Fibonacci retracement level. It indicates that if price breaks below $200 support, BCH will fall to 1.272 Fibonacci extension level or $180 low. In the meantime, BCH is trading at $224 at the time of writing.


