
 Cryptos Price Analysis (September 5 – September 11, 2020): BTC, ETH, XRP, and BCH
In the week under consideration, all the coins plunged to their respective lows. This is a sequel to the general break down in the crypto currency markets. Unavoidably, the king coin and the altcoins will be compelled to make a deep correction on the upside.
BTC/USD Major Trend: Bearish
Today, Bitcoin has fallen to the $10,000 support and it has been consolidating above it for the past three days. On September 1, the bulls broke the $12,000 overhead resistance but fail to sustain the upward move. Analysts believe that the $12,000 to $12,500 resistance is a strong zone. However, the failure of the bulls resulted in the downtrend. The bears broke the crucial support levels of $11,200 and $11,100.
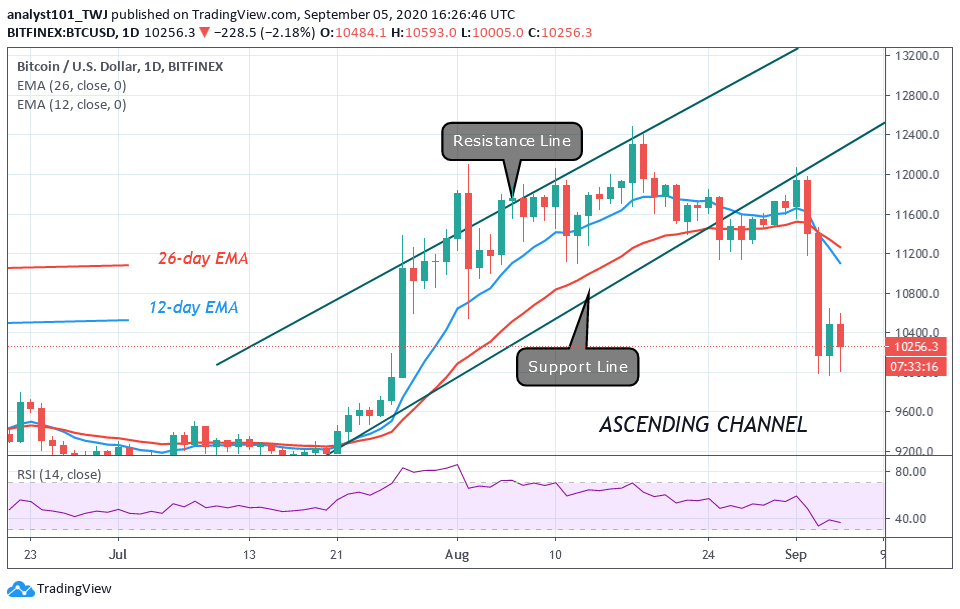
These support levels could not hold the bearish onslaughts as the BTC plunged to $10,000 low and pulled back. BTC price is fluctuating above $10,000 at the time of writing. Nonetheless, if the bears break below the $10,000 support, BTC will drop again to either $9,800 or $9,700.On the August 25 downtrend, the coin fell to $11,200 but price retraced upward.
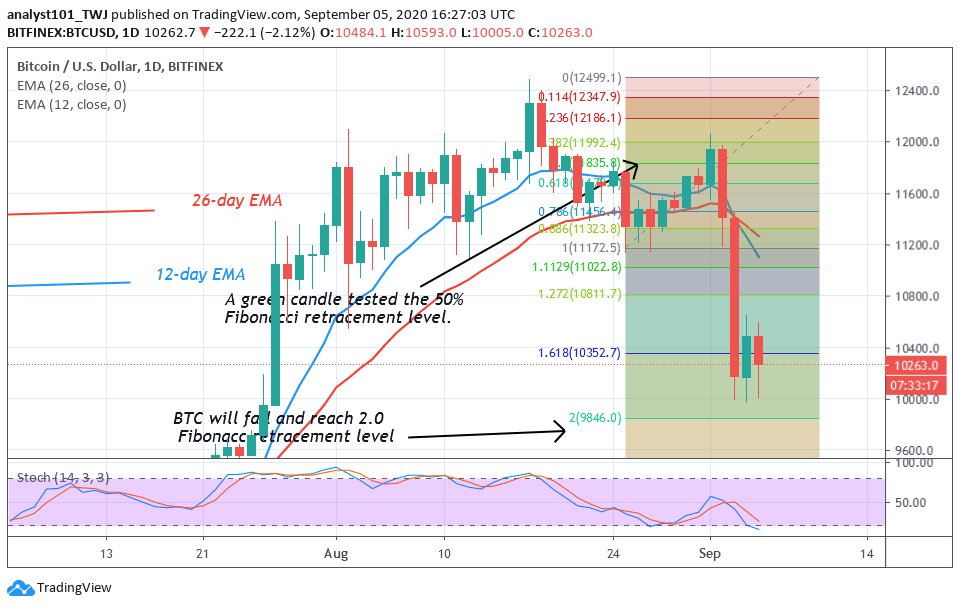
The retraced candle body tested the 50% Fibonacci retracement level. This gives us the clue that if the $10,000 support is breached, BTC will drop to 2.0 Fibonacci extension level or the low of $9,800.
ETH/USD Major Trend: Bearish
Today, Ethereum is on a downward move as price reaches a low of $356 at the time of writing. On September 1, buyers pushed Ether to a high of $488 but they faced rejection at the recent high. In the first bearish impulse, price broke the support levels but found support below $440. After a retest at $440, the bears broke the remaining support level but found support above $380. The market consolidated above this support for three days.
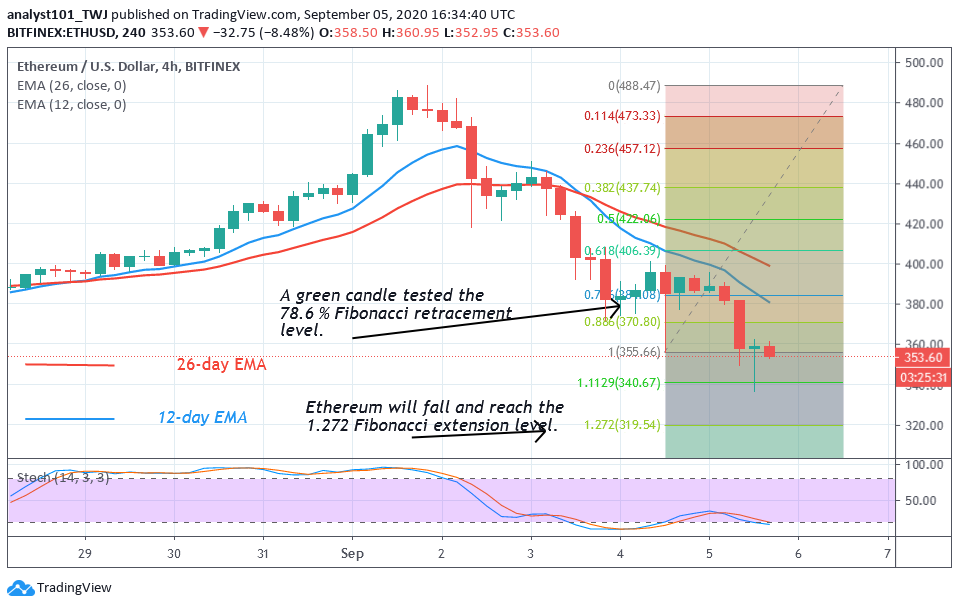
The upside momentum could have resumed if the bulls pushed ETH above $400 or EMAs. However, the bears broke the $380 crucial support as the coin continued the downward move. According to the Fibonacci tool, a retraced candle body tested the 78.6% Fibonacci retracement level. This implies that Ether will fall to 1.272 Fibonacci extension or $320 low, but there will be price reversal. The price will reverse and return to 78.6% retracement t where it originated.
XRP /USD Major Trend: Bearish
The ripple downward move was as a result of the formation of a bearish double top pattern in August. The bears pushed prices to a low of $0.26 on August 27. The bulls buy from the dips and pushed the coin to $0.30.
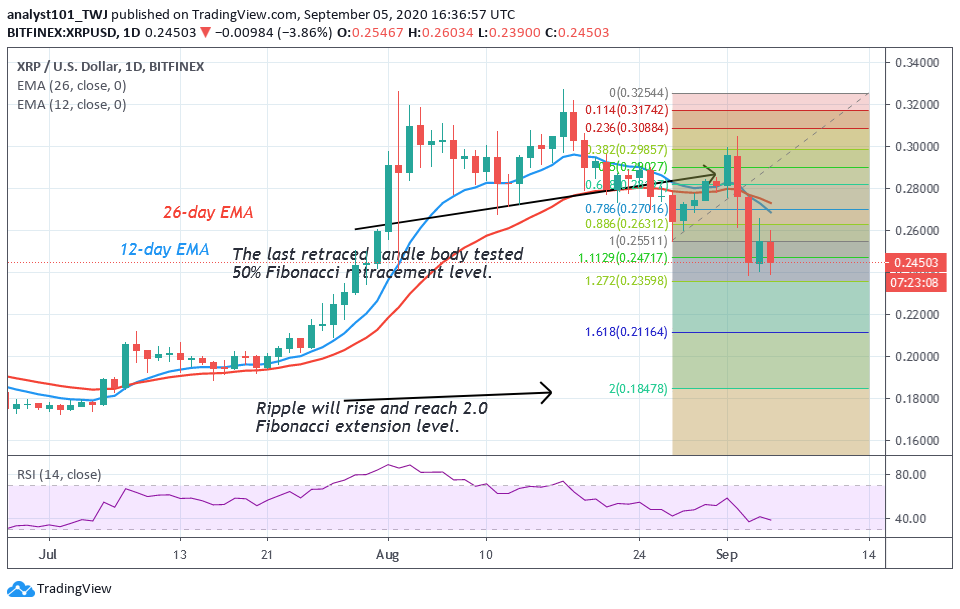
Buyers would have broken the resistance at $0.30 and $0.32 if the upside momentum is sustained. However, the bulls could not sustain price above $0.30. The selling pressure resumed again as price broke the $0.26 support and to the low of $0.23. Meanwhile, price is currently fluctuating above $0.23 support. The downtrend is likely to continue. On the August 27 downtrend, Ripple fell to $0.26 low, but price was corrected upward. The retraced candle body tested the 50% Fibonacci retracement level. This explains that the market will fall to a low 2.0 Fibonacci extension level or $0.19 low.
BCH /USD Major Trend: Bearish
Bitcoin Cash downtrend was as a result of the formation of a bearish triple top pattern. Buyers in August made frantic efforts to break the $320 overhead resistance but to no avail. In the last attempt to break it BCH dropped to $260 low and price was corrected upward.
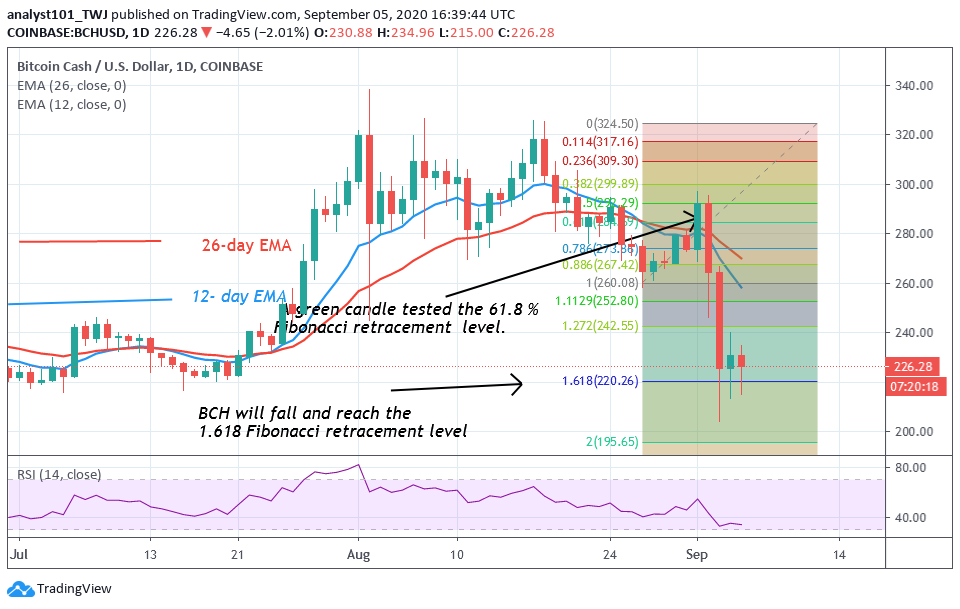
The bulls made the fourth appearance to retest the overhead resistance but were repelled at $290 high. The last resistance plunged the crypto to a low of $203. It appears the coin has reached bearish exhaustion. Meanwhile, on the August 27 downtrend, BCH fell to $260 low but price retraced and tested the 61.8 % Fibonacci retracement level. It indicates that the coin will fall and reach the 1.618 Fibonacci extension level or $220 low.


