

Bitcoin (BTC) and the other altcoins have been in upside momentum. BTC reached its recent high at $16,400 but it has dropped. The uptrend will resume once the bulls buy the dips. The altcoins have made impressive bullish runs. Nonetheless, the cryptos are retracing after their recent rallies. The upside momentum will resume after the coins find support at their respective lows.
BTC/USD Major Trend: Bullish
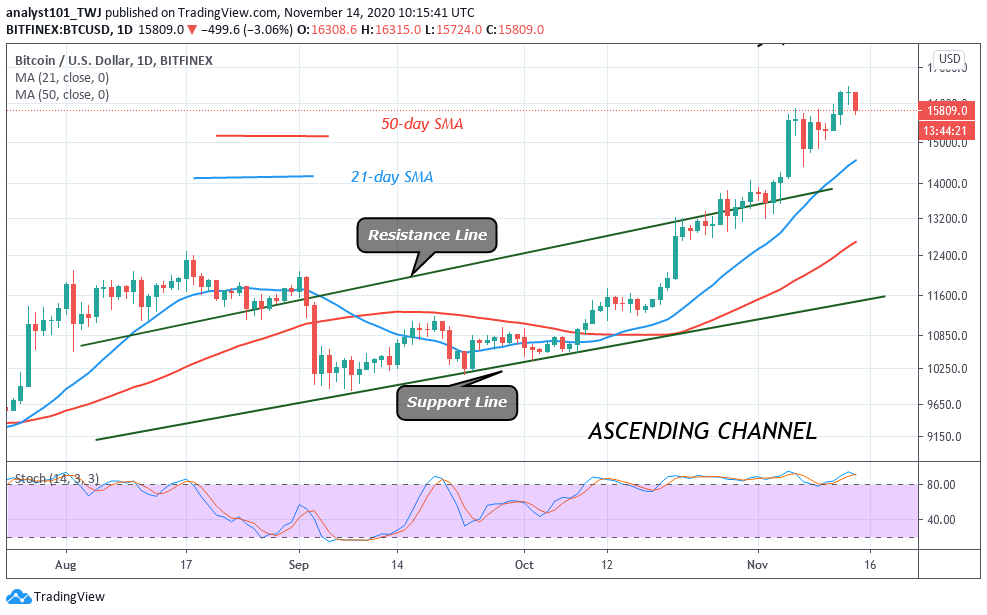
In the previous week, Bitcoin was in a sideways move after price rallied to $15,888 on November 6. The $16,000 resistance zone provided stiff resistance as the bulls were repelled. BTC was compelled to a sideways move as bulls continue to retest the resistance zone. Bitcoin was fluctuating between $15,000 and $15,800 until the resistance was breached on November 12. After the breakout, the price rallied to $16,400. The crypto appears to be fluctuating between $16,000 and $16,400. If the consolidation persists, then a breakout or breakdown is imminent. BTC will rally above $17,000 if the price breaks the $16,400 resistance. Conversely, if the price breaks below $16,000, it will indicate a sign of weakness. However, if the bulls buy the dips the upside momentum will resume.
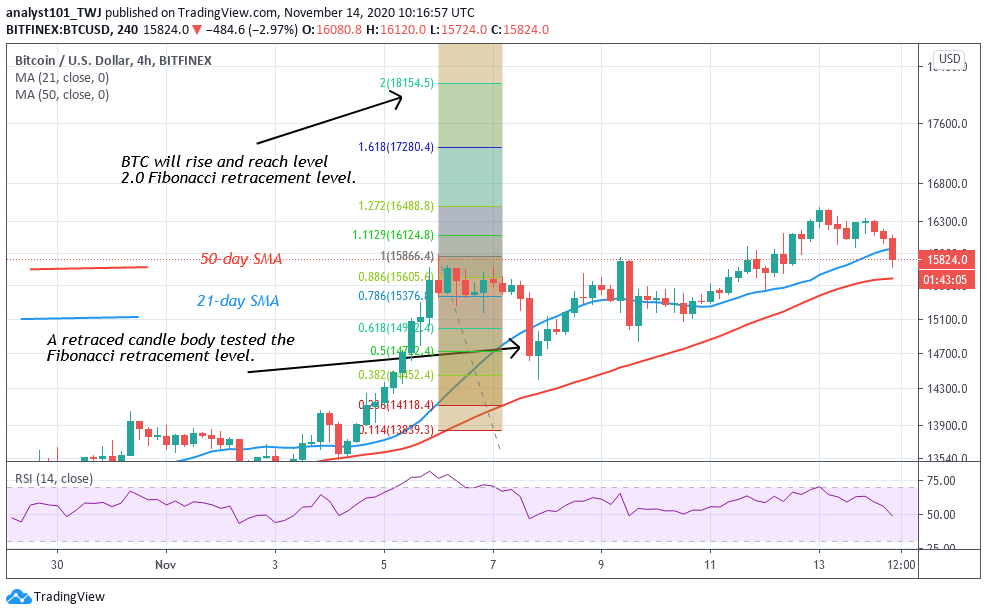
Today, BTC has dropped to $15,829 at the time of writing. Meanwhile, on November 6 uptrend; BTC was resisted at the high of $15,888. However, the retraced candle body tested the 50% Fibonacci retracement level. This retracement indicates that Bitcoin will rise to level 2.0 Fibonacci extensions. That is the market will reach a high of $18,154.50.
ETH/USD Major Trend: Bullish
For the past week, Ethereum bulls have been struggling to break the $480 resistance. On November 7, the biggest altcoin rallied to $467 and was resisted. Buyers have not been able to push the coin above $480 high but have been able to sustain the price level above $450 support. The upside momentum will be invalidated if the price breaks below the $450 support.
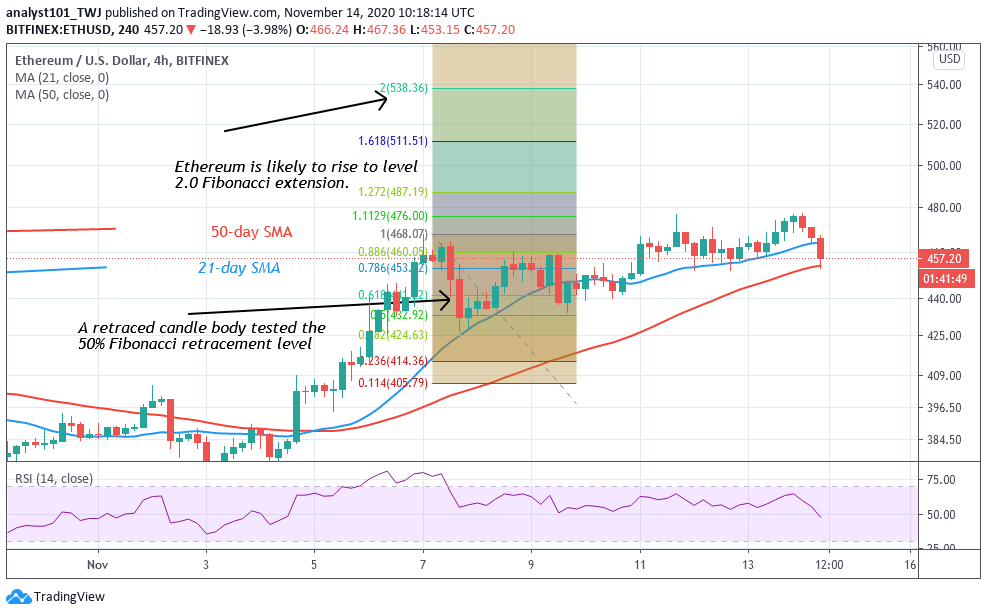
This week there is the possibility of price breaking the $480 resistance. Yesterday, the price breached the high of $477 but was resisted. Nonetheless, a strong bounce above the current support is capable of breaking the $480 resistance. For example, if the $480 resistance is breached, the market will rise to $488 high. Nonetheless, a further push above the $488 high will propel price to rally above $500. On the daily chart, a Fibonacci tool analysis has been used. On November 7 uptrend, a retraced candle body tested the 50% Fibonacci retracement level. This indicates that Ether will rise and reach level 2.0 Fibonacci extension which is $538.36.
XRP /USD Major Trend: Bullish
Yesterday, Ripple‘s price action culminated to the highest level as bulls took a giant stride to break the $0.26 resistance level. Ripple has been range-bound since September 2. The overhead resistance at $0.26 has impeded the coin upward move. In the previous week, Ripple has two false breakouts on November 7 and 10.
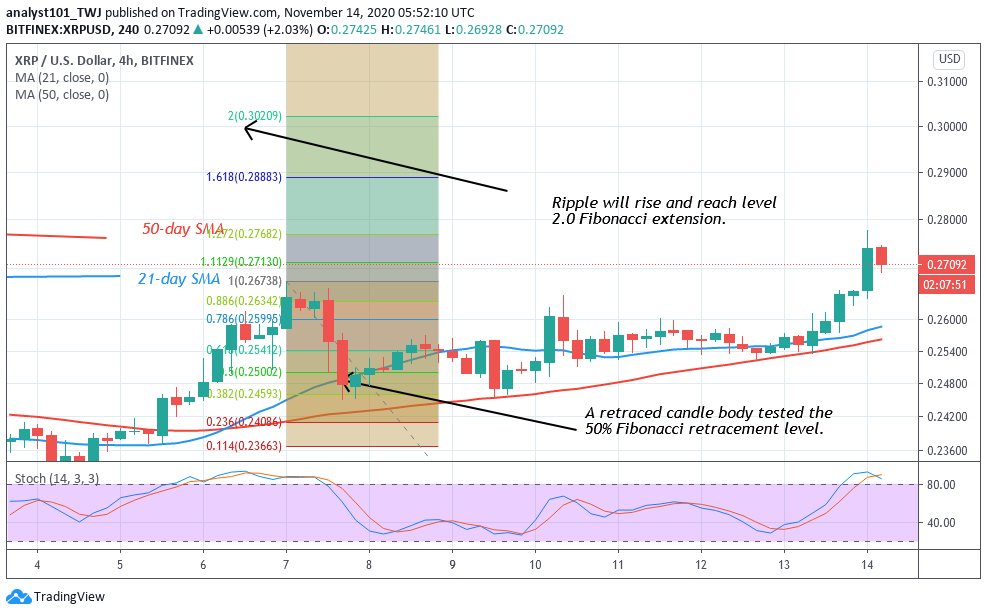
The price fell back to the range-bound zone. Yesterday’s breakout has been holding in the last 24 hours. The bulls must sustain the price above $0.26 support for the upside momentum to continue. Today, XRP reaches a high of $0.277 but has retraced to $0.271 at the time of writing. This week, XRP is likely to rise to $0.30, if the bullish momentum is sustained above the $0.26 support. However, if the bears break below the $0.26 support, the crypto will return to the range-bound zone. On November 7 uptrend, XRP reached a high of $0.267 and was resisted. The last retraced candle body tested the 50% Fibonacci retracement level. This gives us the impression that the crypto will rise and reach level 2.0 Fibonacci extensions or the $0.30209 high.
BCH /USD Major Trend: Bullish
For the past week, BCH has been in a downward correction after buyers fail to push BCH above $280 resistance. On November 7, the coin rallied to $277 but was repelled. BCH plunged to $245 low. Subsequent upward corrections were repelled as BCH now trades at $258 at the time of writing.
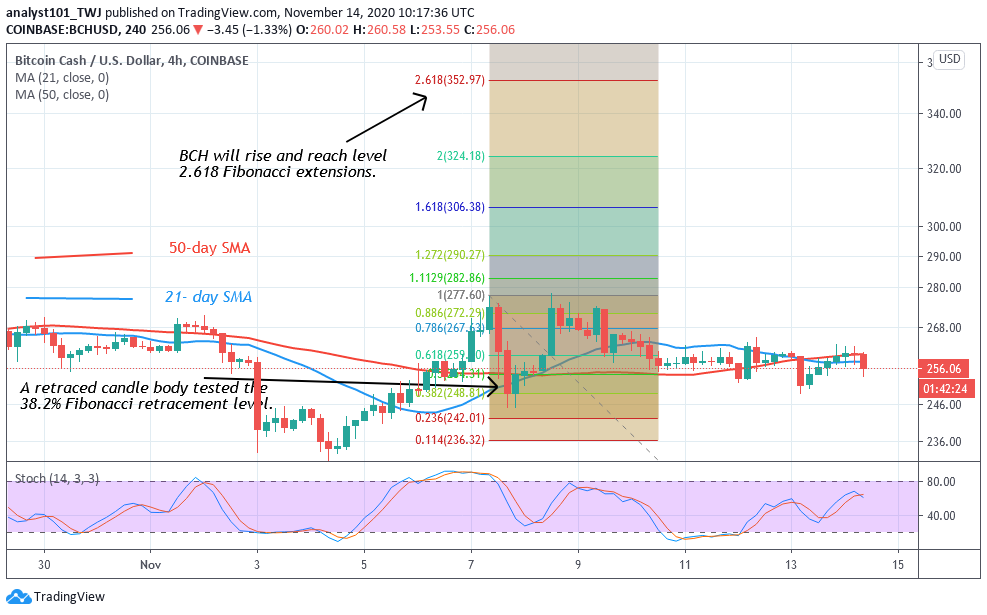
Nonetheless, after its fall at the $251 low, the crypto has been fluctuating between $251 and $264. The bottom line is that if the bears break the $250 support, the downtrend will resume. There is a likelihood of price reaching a low of $216 support. On the upside, if the $250 support holds, the upside momentum will resume. A retest at the $280 resistance is likely. Meanwhile, on November 7 uptrend, BCH was resisted. The retraced last candle body tested the 38.2% Fibonacci retracement level. This retracement gives us the impression that the coin will further rise to level 2.618 Fibonacci extension. This is equivalent to $352.97 high.


