
Bitcoin and the three altcoins have continued to rally on the upside. The bulls have been able to clear the overhead resistances of the respective cryptos. For example, BCH has breached the $280 overhead resistance as the coin resumed price acceleration. This week the cryptos are likely to attain new highs.
BTC/USD Major Trend: Bullish
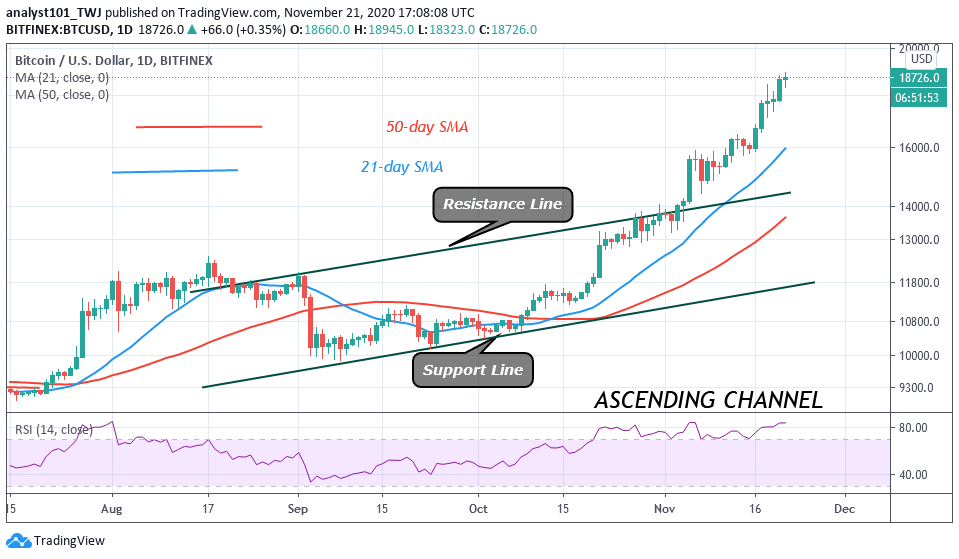
Bitcoin price has continued to be on the upside momentum since the previous week. Initially, the uptrend was impeded at the $16,400 high on November 12. The coin has a downward correction for about three days. On November 16, the coin rebounded above $15,900 as price rallied on the upside. The price momentum has broken the $16,400 resistance and rallied to $18,200. Presently, the BTC price has broken the resistance at $18,200 as the coin reached a high of $18,800. The crypto is in a sideways move below the resistance at $18,800.
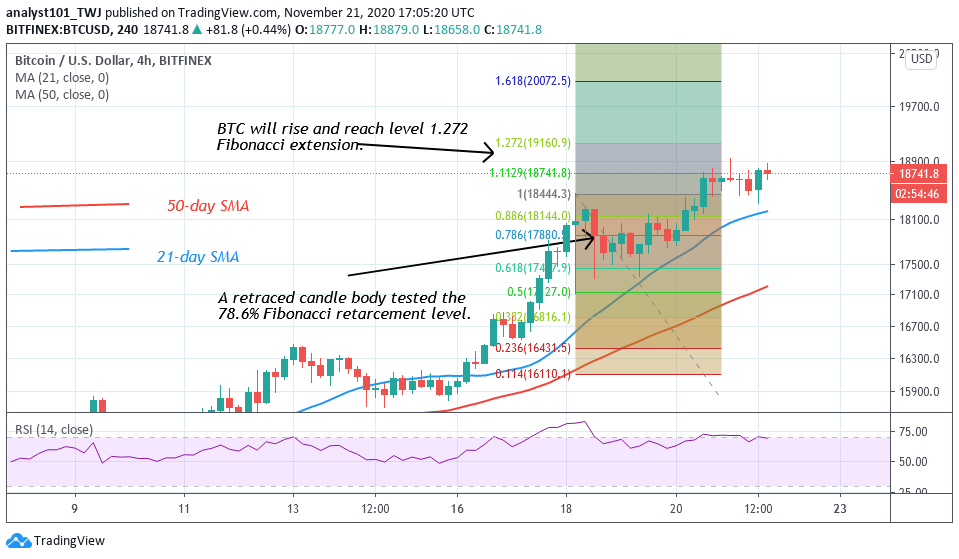
From the 4 – hour chart, the BTC price is fluctuating below the $18,800 resistance. On November 18 uptrend, BTC reached a high of $18,276 and was resisted. The retraced candle body tested the 78.6% Fibonacci retracement level. This implies that Bitcoin will rise to level 1.272 and reverse. That is the coin will reach a high of $19,160.90 and later reverse.
ETH/USD Major Trend: Bullish
Recently, Ethereum bulls succeeded in breaking the$480 overhead resistance. On November 18, the altcoin has a breakout but the bulls could not sustain the upward move. Consequently, Ether has a breakdown as the coin plunged to $459 low. After two days of correction, the coin rebounded above the $470 low to resume an upside momentum. This recent rebound broke the $480 overhead resistance. The momentum extended to reach the first target at $488 high. Today, Ether has risen and it is trading at $522 at the time of writing.
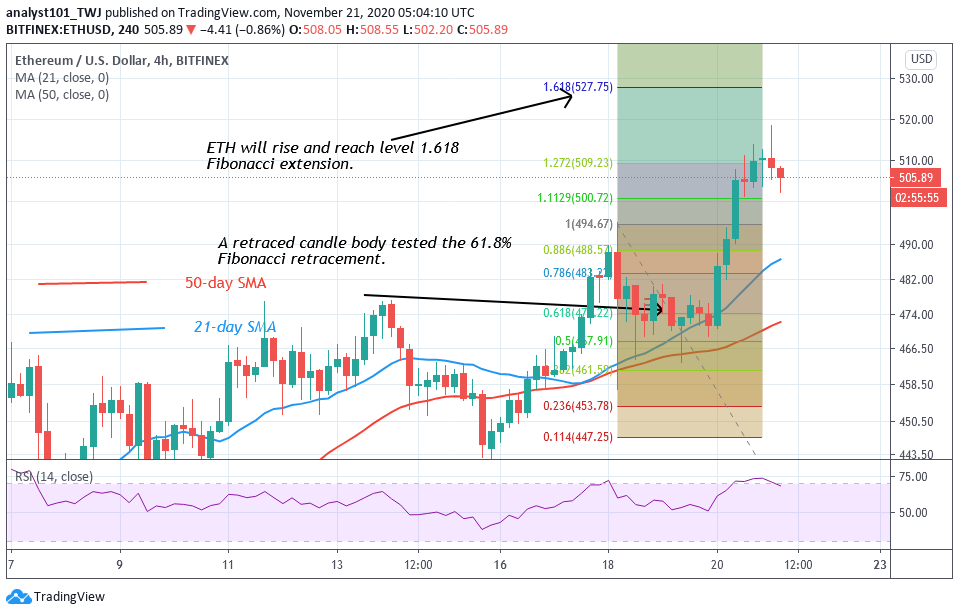
According to the Fibonacci analysis, Ethereum is capable of a further upward move. On November 18 uptrend, the coin reached a high of $490 and was resisted. The retraced candle body tested the 61.8% Fibonacci retracement level. The retracement indicated that the coin will rise to level 1.618 Fibonacci extensions. That is the altcoin will reach a high of $527.75. The price action has almost reached the projected price level. However, this week we expect the price to reach the $550 high.
XRP /USD Major Trend: Bullish
For the past week, November 14, Ripple bulls broke the $0.26 overhead resistance as price rallied $0.30 high. This will be the first time the overhead resistance will be broken since September 2. In the first uptrend, the rally was stalled at the $0.305 resistance. On November 18, after the bearish reaction, XRP plunged to $0.289. At the recent low, the bulls buy the dips as price rallied on the upside. The current rally has reached a high of $0.39 at the time of writing. The bulls have succeeded in breaking the resistance at $0.305 and the $0.32 overhead resistance.
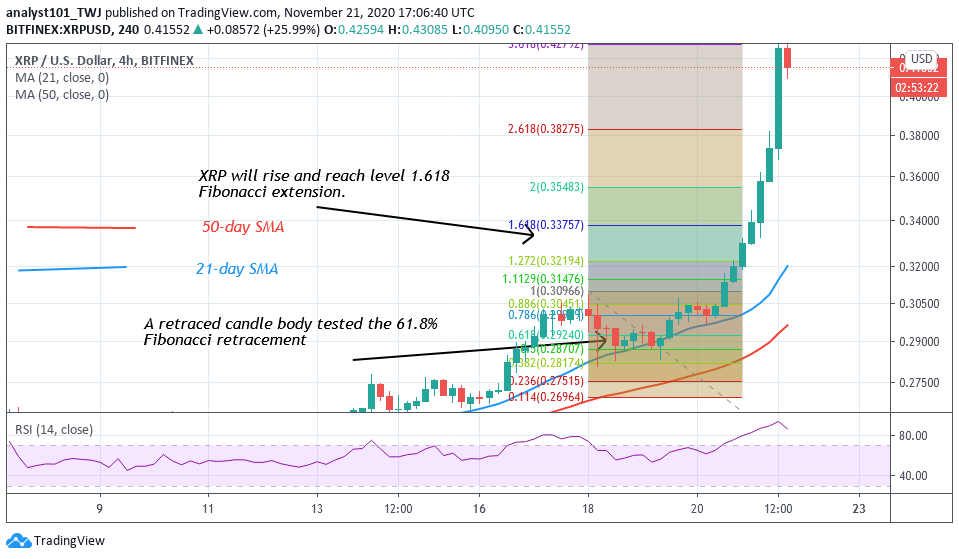
This week, if buyers sustain the current upside momentum, Ripple will surpass the high of $0.40.Meanwhile, from the 4 -hour chart, the price action surpassed the projected price level of the Fibonacci tool analysis. On November 17 uptrend, the coin was resisted. The last retraced candle body tested the 61.8% Fibonacci retracement level. This implies that XRP will rise to level 1.618 Fibonacci level or $0.3375 high. However, the market has risen above this level.
BCH /USD Major Trend: Bullish
For the past week, BCH has been on a downward correction below the $260 resistance. Buyers were unable to push the coin on the upside as the crypto fell to the critical support at $250 . In the previous week, the coin has been trading in a tight range between $236 and $270. Nonetheless, on November 20, BCH rebounded as the price momentum broke the minor resistance at $260 and $270.
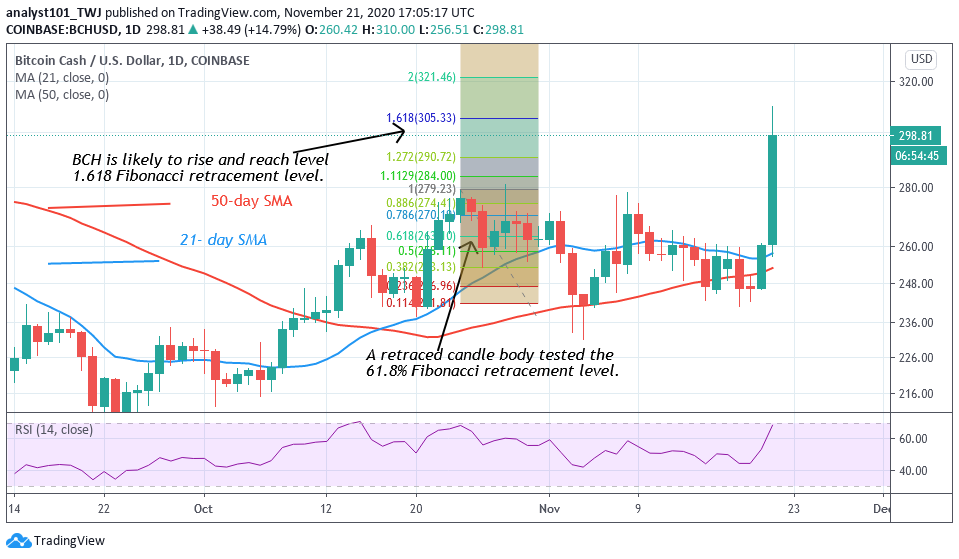
The bullish momentum also broke the $280 overhead resistance. Today, the altcoin has reached a high of $295 at the time of writing. On the upside, if buyers sustain the current momentum, BCH will rally above $320 high.Meanwhile, there is a possibility of a further upside move as bulls break the overhead resistance. On October 26, a retraced candle body tested the 61.8% Fibonacci retracement level. It indicates that the crypto will rise and reach level 1.618 Fibonacci extensions or the high of $305.95. The price action has almost reached the suggested price level.


