

For the past week, Bitcoin and the three altcoins were rallying to different price levels. For example, BTC reached a high of $19,400 which is almost close to the 2017 price level of $20,000. Unfortunately, the cryptos faced rejection on November 24, as there was a general breakdown which led to the coins dropping sharply. This week the cryptos are likely to recover and resume the upside momentum.
BTC/USD Major Trend: Bullish
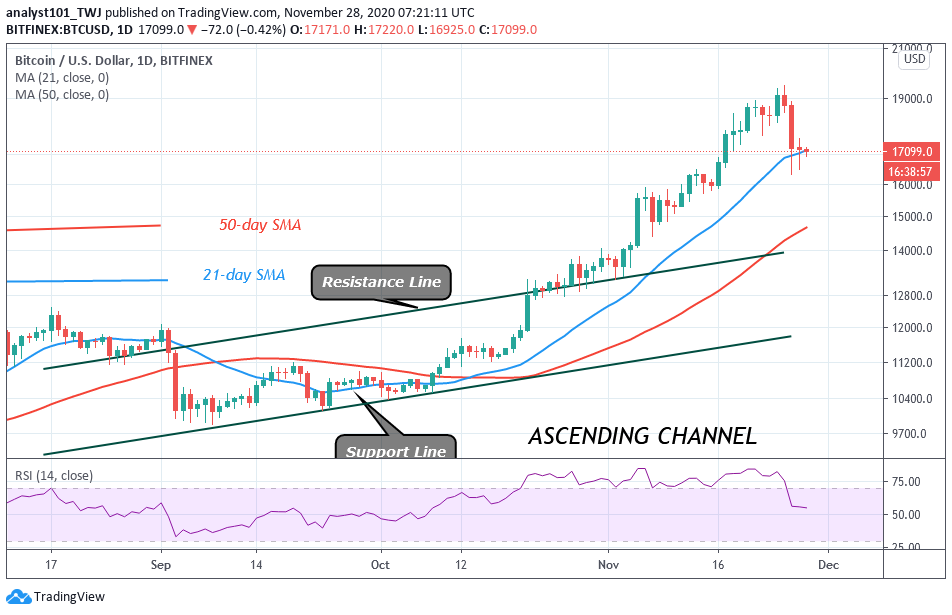
For the past week, on November 21, BTC rallied to $18,800 but the bulls could not break the resistance level. However, after four days of correction, BTC rebounded above $18,400 support to break the resistance level. The king coin rallied to $19,400 high on November 24 but could not continue the uptrend. The following day the resistance was retested resulting in the formation of a bearish double top. Consequently, BTC plunged to $16,500 low on November 26.
In the last three days, BTC has been fluctuating between $16,500 and $17,500. Today, BTC is trading at $17,101 at the time of writing. On the upside, if buyers push BTC above $17,500, the upside momentum will resume. Buyers may want to retest the previous highs including the $19,400 resistance.
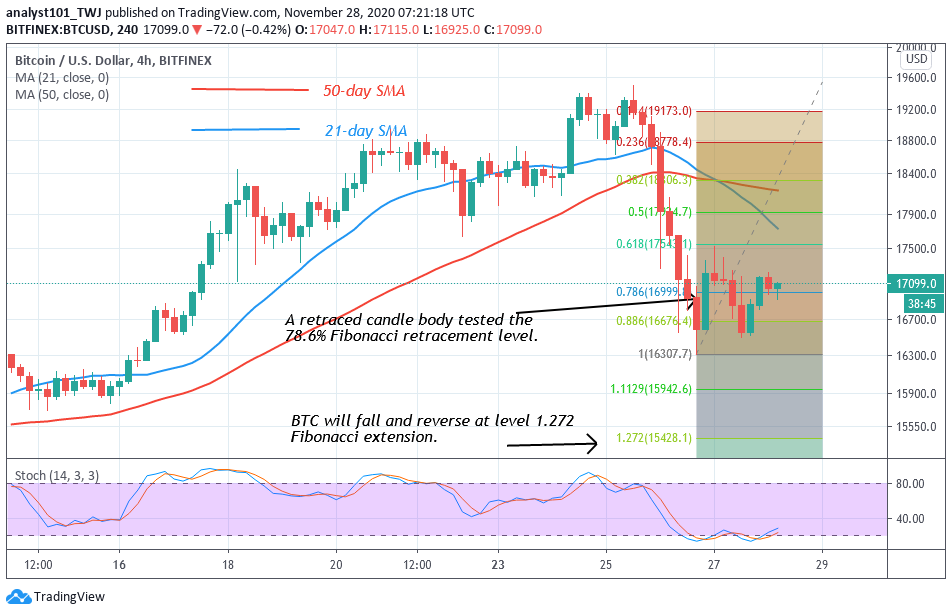
Conversely, if sellers break below $16,500 support, the coin will further decline. The decline will reach the 1.272 Fibonacci extension level or $15,428 low. The Fibonacci tool has indicated that on November 26 downtrend; the retraced candle body tested the 78.6% Fibonacci retracement level. This retracement indicates that the coin will fall and reverse at 1.272 extensions or $15,428.10 low. At this level, the market will resume the upside momentum.
ETH/USD Major Trend: Bullish
Ethereum achieves more price acceleration after the breaching of the $480 overhead resistance in the previous week. On November 20, the bulls broke the $480 resistance and rallied to $560 high. After a pullback, the biggest altcoin rallied to $620 on November 24. The selling pressure above the recent high was overwhelming as Ether was rejected. On November 26, the crypto fell to $480 low and resumed consolidation above it.
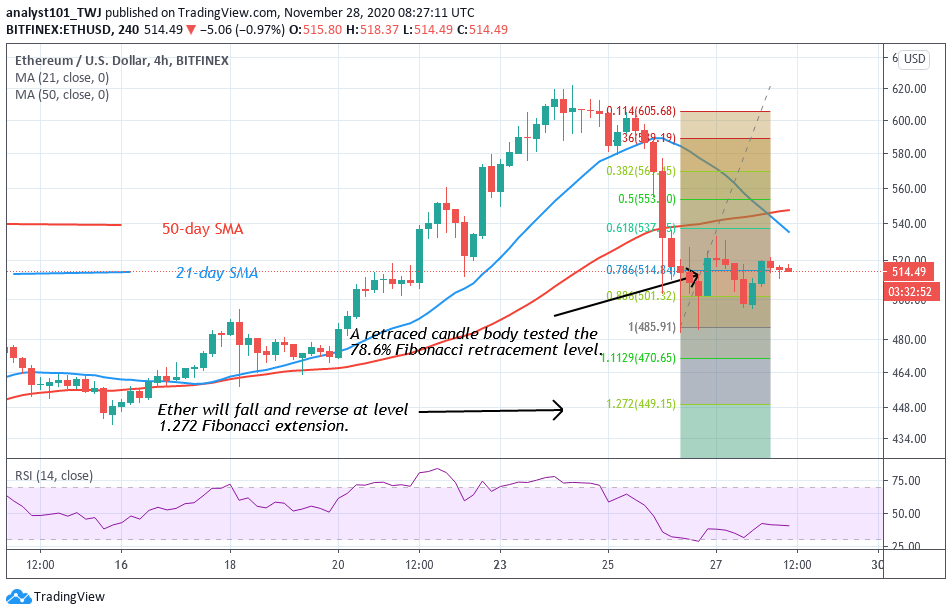
The November 26 candlestick is having a long tail. This indicates that there is buying pressure at a lower price level. In other words, the $480 support is likely to hold. Meanwhile, in the last three days, Ethereum is fluctuating between $480 and $530. The coin will resume upward movement once, it breaks above the $530 resistance. Similarly, if the bears succeed in breaking the $480 support, the coin will fall and reach level 1.272 Fibonacci extension level or $449 low. As indicated on the 4-hour chart, a retraced candle body tested the 78.6% Fibonacci retracement level. This retracement indicates that the coin will fall and reverse at level 1.272 Fibonacci extensions or $449.15 low.
XRP /USD Major Trend: Bullish
In the previous week, Ripple was trading in the $0.30 resistance zone. Buyers could not easily push the XRP above the $0.30 high after breaking the $0.26 overhead resistance. Following the successful breaking of the $0.30 high, XRP rallied to $0.48 high. Buyers could not penetrate the $0.48 resistance zone. However, after three days of correction, the $0.48 resistance was breached. The upside momentum continued to a high of $0.78.
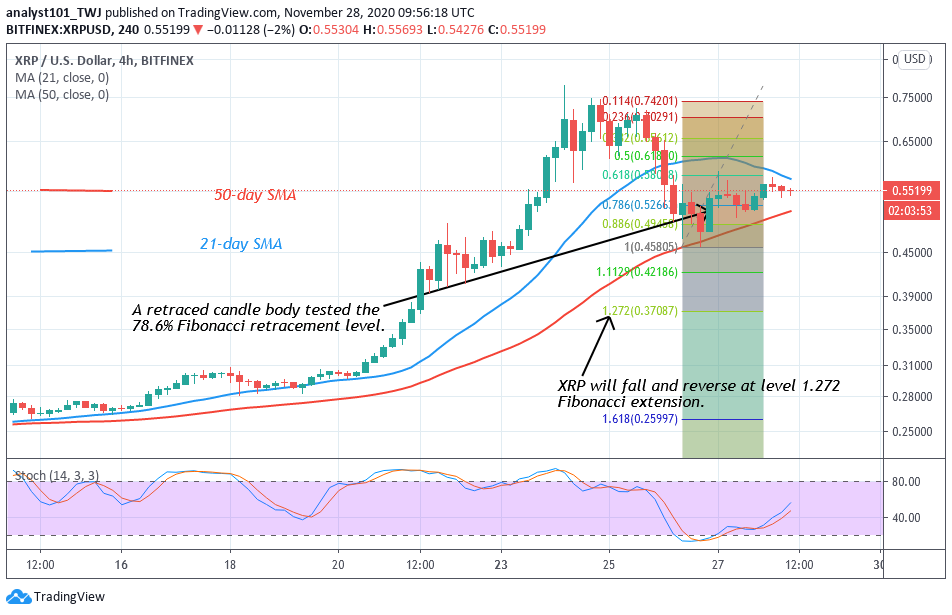
On November 24 candlestick showed a long wick. This indicates that there is strong selling pressure at a higher price level. XRP declined after rejection at the recent high. It slumped to $0.45 low and resumed a sideways move. Today, Ripple is trading at $0.56 at the time of writing. Presently, the coin is fluctuating between $0.45 and $0.58. On the upside, if price breaks above the $0.58 high, XRP will resume upside momentum to retest the previous high of $0.65 and $0.70. The downtrend will resume if price breaks below the $0.45 support. The coin will fall to level 1.272 Fibonacci extensions or $0.370 low
BCH /USD Major Trend: Bullish
Last week, November 21, the $280 overhead resistance was breached by the bulls. BCH rallied to $306 high and was resisted. XRP retraced to $280 support and resumed the upside momentum. On November 24, BCH rallied to $360 high but was resisted. The November 24 candlesticks are displacing long wicks. These long wicks are indicating that there is strong selling pressure at a higher price level.
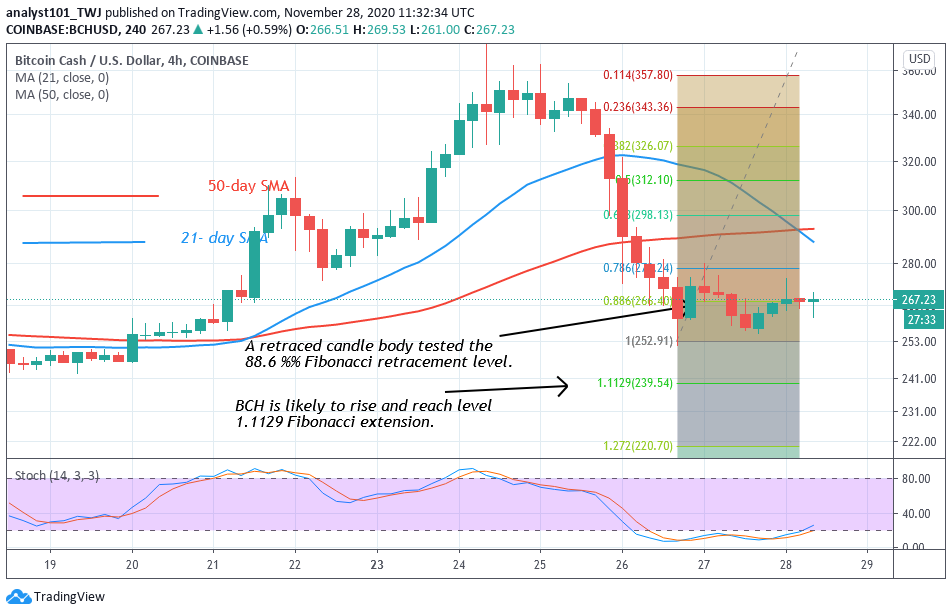
After rejection on November 25, BCH slumped to $256 low. The coin has been fluctuating between $256 and $280 in the last three days. As the coin continues to fluctuate in a range, a breakout or breakdown is imminent. For example, a break down will compel the coin to decline. The decline is likely to reach the Fibonacci extension of 1.272 or $252.91 low. This is because, during the downtrend of November 26, a retraced candle tested the 88.6% Fibonacci retracement level. This retracement gives birth to level 1.129 Fibonacci extension or $239.54 low.


