

In its recent rallies, Bitcoin is struggling above the psychological price level of $40.000 to possess it. The crypto is facing strong rejection at the $42,000 resistance level which compels it to be range-bound. The other altcoins are equally surging higher along with Bitcoin except for Ripple which has failed to join the bull market. Despite its fundamental constrain, Ripple is one step more into the bull market.
BTC/USD Major Trend: Bullish
We are looking at what happened to the BTC price for the past week and where the price will be this week. On January 3, BTC price rallied to $34,873 and was repelled. The bulls faced stiff resistance as the coin plunged to $28,540. This breakdown liquidated long term traders who were caught unaware.
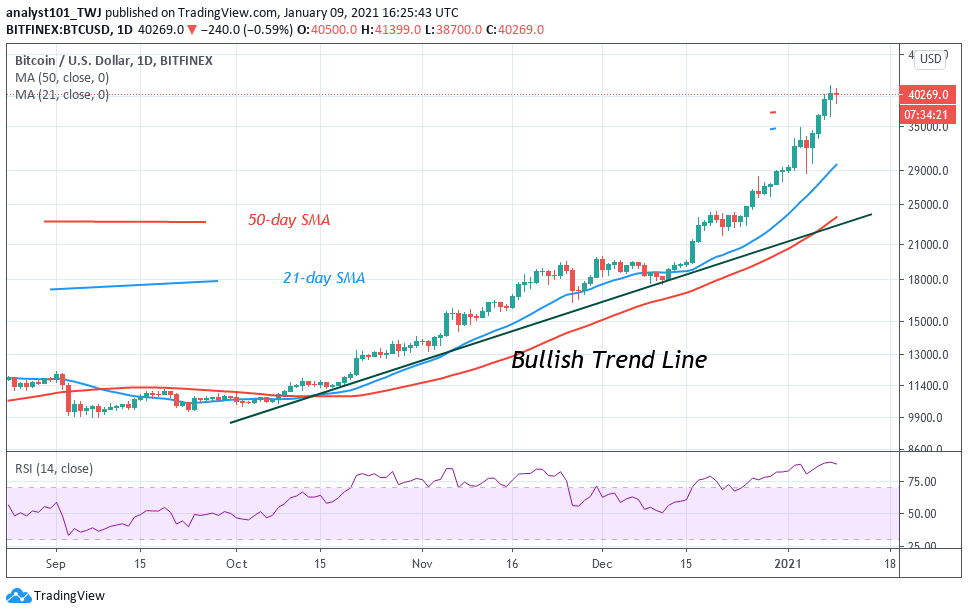
After three days of correction, the bulls broke the $35,000 resistance zone. The breakout was tremendous as the bulls broke the resistances at $37,000 and $38,000. The BTC price rallied above the $40,000 psychological price level. For the past week, the trend was powerful as there was no correction. Nonetheless, the current rally reached a high of $41,649 before pulling back. After the pullback, the BTC price was fluctuating above the $40,000 support. Analysts believe the price will reach the $45,000 high after the present correction.
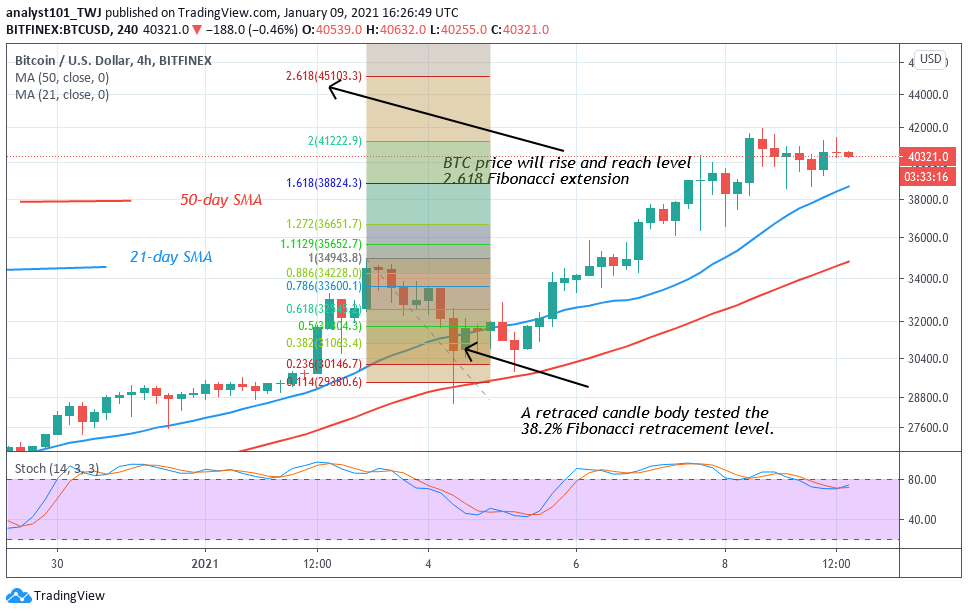
Meanwhile, on January 3 uptrend; a retraced candle body tested the 38.2% Fibonacci retracement level. The retracement gives the impression that BTC price will rise to level 1.618 Fibonacci extension. The indicator shows that the BTC price will reach $45,103.30. However, traders think that BTC price will reach the next psychological price level of $50,000.
ETH/USD Major Trend: Bullish
In the previous week, Ether has the biggest rally like BTC price. On January 4, Ether rallied to $1,159 high but was repelled. Consequently, the crypto declines to $860 as bulls buy the dips. The bulls retested the resistance zone but after three days of correction, the $1,100 resistance was breached. The breakout accelerated price movement as price rallied to $1,300.
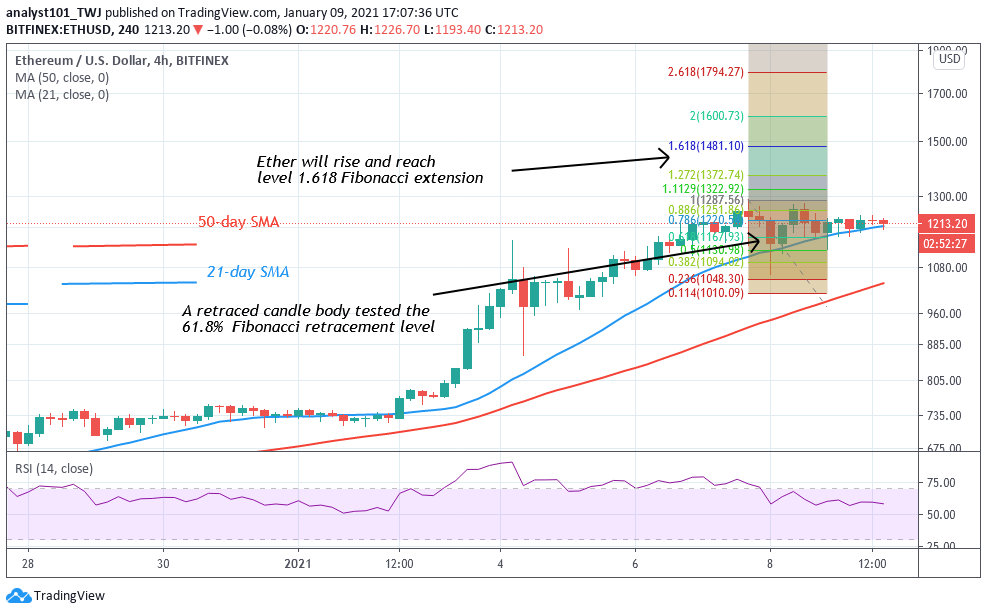
Since January 7, Ether has been trading below the recent high. For the past three days, the biggest altcoin has been fluctuating between $1,100 and $1,300. The bottom line is that as long as $1,100 support holds, Ethereum will continue its upside momentum. On the upside, if buyers push the coin above $1,280, a rally above $1400 is expected. On the other hand, if sellers break the $1,100 support, Ether will drop to $880 low. Nevertheless, on January 7 uptrend, Ether was resisted. The retraced candle body tested the 61.8% Fibonacci retracement level. This retracement gives the impression that ETH will rise and reach level 1.618 Fibonacci extensions or $1,481.
XRP /USD Major Trend: Bullish
In the previous week, Ripple has been in a downward correction. The crypto has been consolidating above $0.22 support for over a week before the recent rebound. The crypto rallied to $0.36 high and was resisted. XRP fell to $0.28 low and resumed consolidation above the current support. Today, XRP is fluctuating above the $0.31 support.
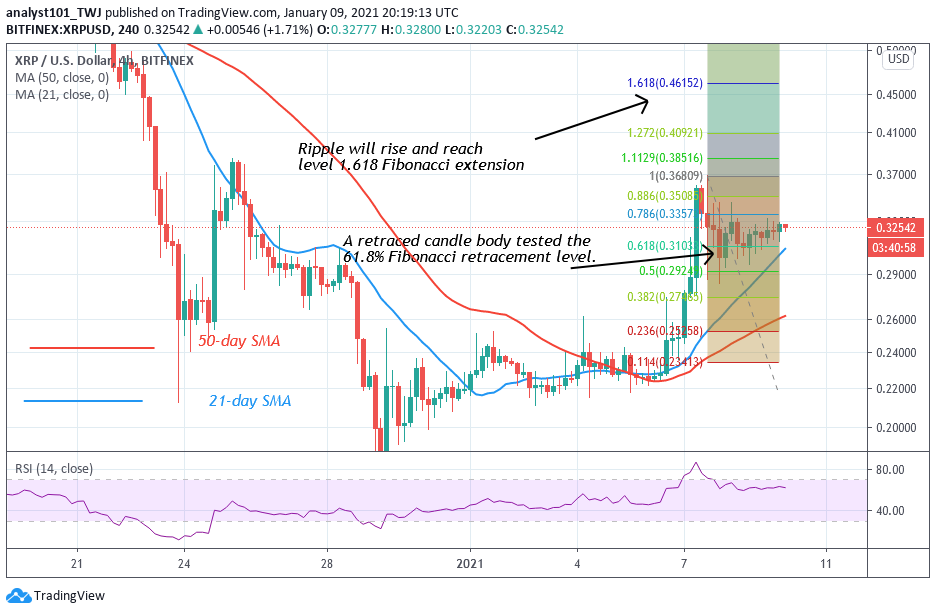
There has been no significant price movement. Buyers are to push the coin above $0.45 high. This will place the coin in the bullish trend zone to resume the upside momentum. However, if the bulls fail to push XRP on the upside, there will be a strong tendency for the coin to fall. The Fibonacci tool has indicated a possible upward move of the coin. Meanwhile, on January 7 uptrend, a retraced candle body tested the 61.8% Fibonacci retracement level. The retracement implies that Ripple will rise to level 1.618 Fibonacci extension or $0.461 high.
BCH /USD Major Trend: Bullish
Today, BCH has rallied to $654 in a price spike before pulling back to $568. Before the recent breakout, the crypto has been struggling to resume upside momentum above $400 and $440.The coin rebounded and broke the $440 resistance level. BCH is now fluctuating above $550 for a possible upward move. The recent price action is a confirmation of the Fibonacci tool analysis. According to the Fibonacci tool, there is a possibility of a further upward move. On January 4 uptrend; the retraced candle body tested the 50% Fibonacci retracement level. The retracement indicates that BCH is likely to rise to level 2.0 Fibonacci extensions. In other words, BCH will rise to a high of $602.19.


