

Since January 8, Bitcoin bulls are yet to break the psychological price level of $40,000. The Fibonacci tool has indicated a further upside momentum above the $40,000 high. Bitcoin and Ethereum have similar peculiarities as per recent rallies. Both are likely to attain new highs. Bitcoin Cash may attain a new high this week. In the case of Ripple, it is doubtful as it is yet to join the bull market.
BTC/USD Major Trend: Bullish
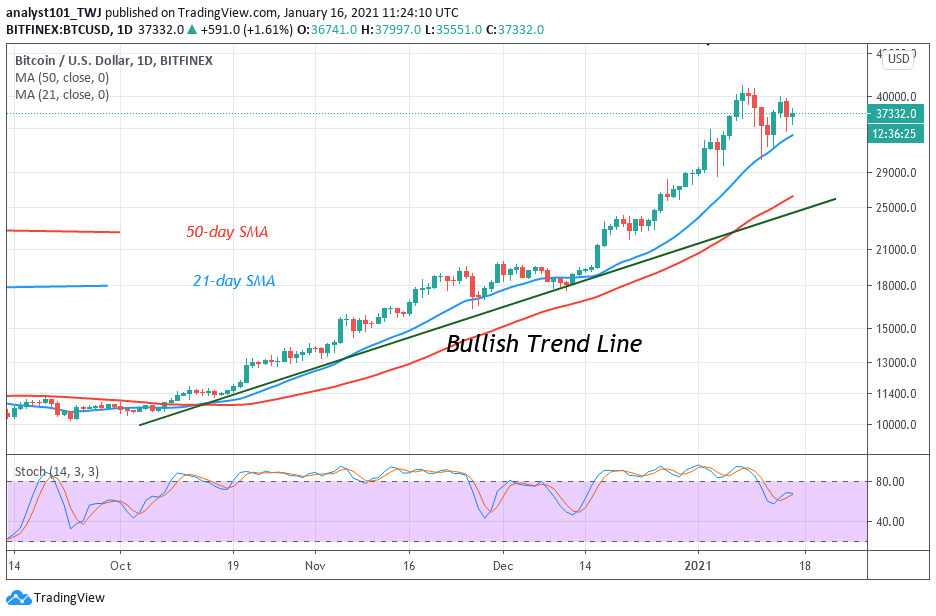
Last week, the BTC price rallied to the psychological price level of $40,000. The bulls broke the resistance level and the bullish momentum extended to $41,649 high. Unfortunately, Bitcoin plunged from the recent high as bulls failed to sustain the rally. The coin fell to $31,327 low but the bulls bought the dips to resume the upside momentum. Buyers pushed the coin as it retests the $40,000 resistance but faced another rejection. BTC price fell to $35,000 low and moved up to the previous highs. Buyers are struggling to break the minor resistance at $38,000.
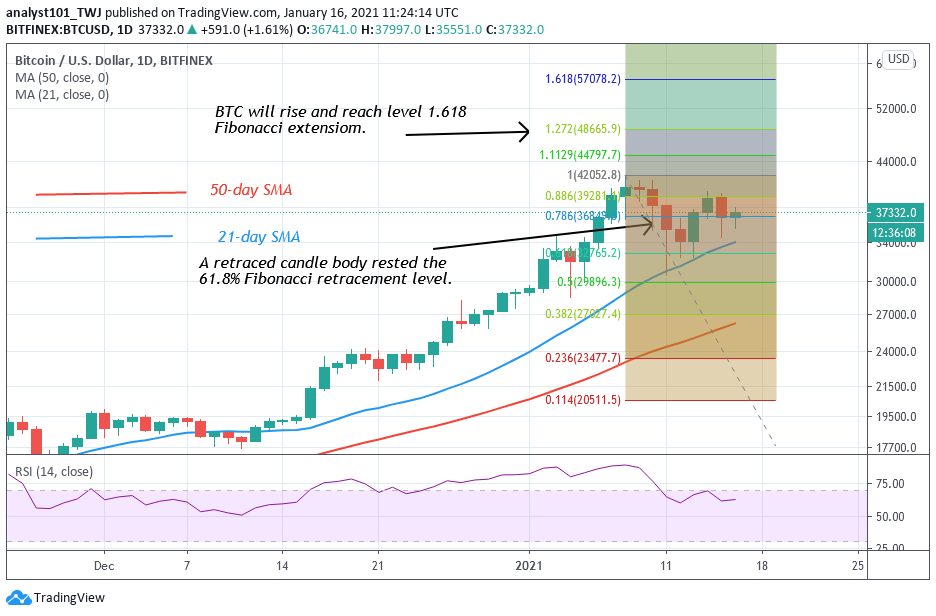
This week, the crypto’s price is likely to break the psychological price level of $40.000. Meanwhile, on January 8 uptrend; a retraced candle body tested the 78.6% Fibonacci retracement level. At this retracement level, BTC price will rise to level 1.272 Fibonacci extensions or the high of $48,665.90. The crypto’s price is likely to retrace at the recent high. In other words, BTC price will retrace to 78.6 % Fibonacci retracement level where it originated
ETH/USD Major Trend: Bullish
Like Bitcoin, Ethereum rallied to a high of $1,306.80 on January 9. The biggest altcoin faced rejection at the recent high. Ethereum plunged to $963 low and the price corrected upward. The upward move was resisted at the $1,240 resistance. For the past week, Ethereum bulls have failed to break the overhead resistance and the minor resistance at $1,240. This week, the upside momentum is likely as Ether struggles to break the minor resistance. Since January 14, buyers have been struggling to break the minor resistance at $1,240. On the upside, a breakout at $1,240 high will propel the price to clear the resistance at $1,300. The crypto will rally above $1,400. In the vein, the bullish momentum will extend to $1,700.
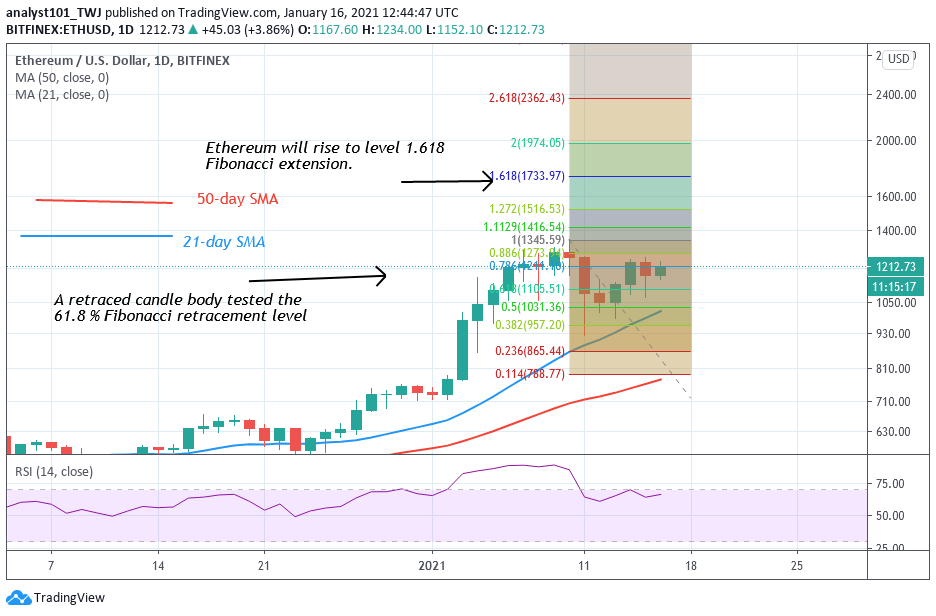
On the other hand, if the bulls fail to break the overhead resistance, the crucial support is likely to be tested and broken. The selling pressure will extend to the low at $840. The Fibonacci tool has indicated an upward movement of the coin. On January 9 uptrend; a retraced candle body tested the 61.8% Fibonacci retracement level. This retracement gives the impression that ETH will rise to level 1.618 Fibonacci extensions or the high of $1,733.97
XRP /USD Major Trend: Bearish
For the past week, buyers have failed to sustain the recent rallies. As a result of this, XRP has continued its downward move. Ripple has fallen from a high of $0.36 to a low of $0.27. The bulls bought the dips at the recent low. The price corrected upward but faced resistance at the $0.31 high. Nevertheless, since January 12, Ripple has been stuck below the $0.31 resistance where buyers tried unsuccessfully to break the overhead resistance. The market will fall to the previous low each time the resistance level is tested.
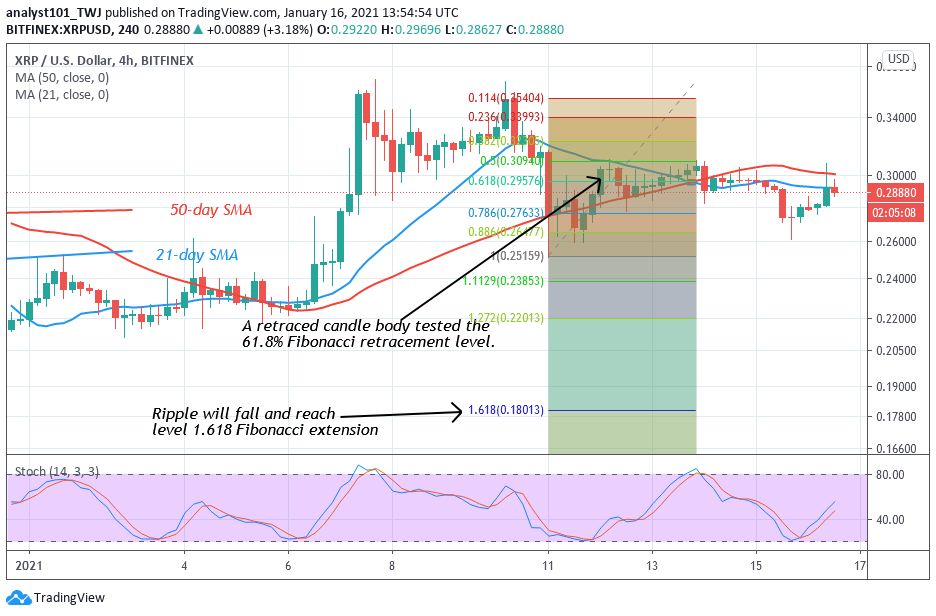
Today, the bulls have tested the $0.31 resistance zone as the coin resumed a downward move. However, the Fibonacci tool has indicated a downward movement of the coin. Meanwhile, on January 11 downtrend; a retraced candle body tested the 61.8% Fibonacci retracement level. The retracement implies that Ripple will fall to level 1.618 Fibonacci extension or $0.18 low
BCH /USD Major Trend: Bullish
In the previous week, BCH rallied and attained a peak price of $654 on January 9. However, buyers could not sustain the bullish momentum as the coin dropped to $397 low. The bulls bought the dips as price corrected upward. The upward move was short-lived as the bulls were resisted at the $540 resistance zone. BCH is now trading at $540 resistance zone. On the upside, if buyers pushed BCH above the $540 resistance level, the coin will retest the $654 overhead resistance.
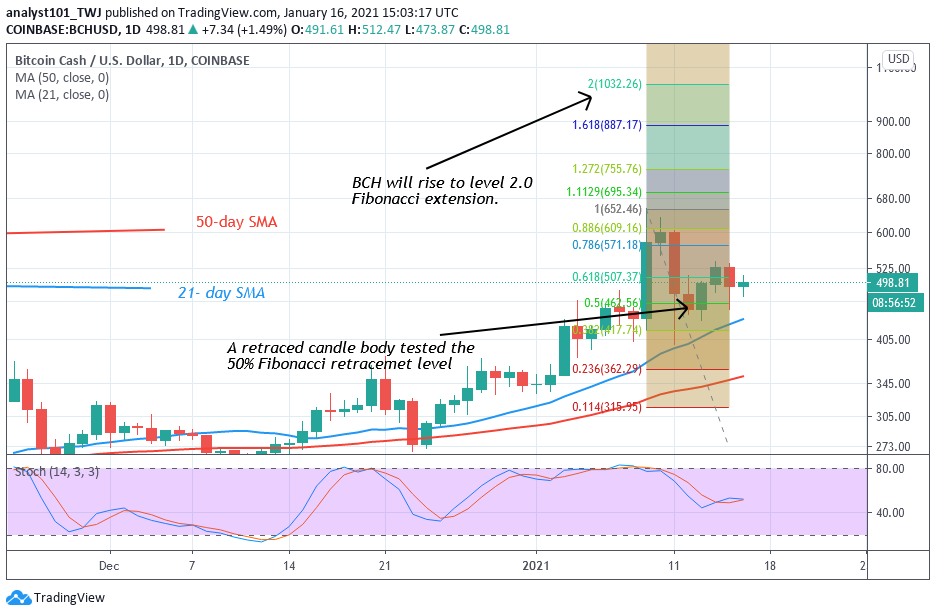
Conversely, if the bulls failed to break the resistance levels, BCH will be range-bound between $440 and $540. The Fibonacci tool has indicated an upward movement of the coin. On January 10 uptrend; the retraced candle body tested the 50% Fibonacci retracement level. The retracement indicates that BCH is likely to rise to level 2.0 Fibonacci extensions. In other words, BCH will rise to a high of $1,032.26.


