For the past week, the coins under consideration were battling with downward corrections. Some of the coins have fallen to the oversold region suggesting buyers to take control of price. The coins are still holding and sustaining the major trend. The altcoins and the king coin are expected to resume upside range momentum.
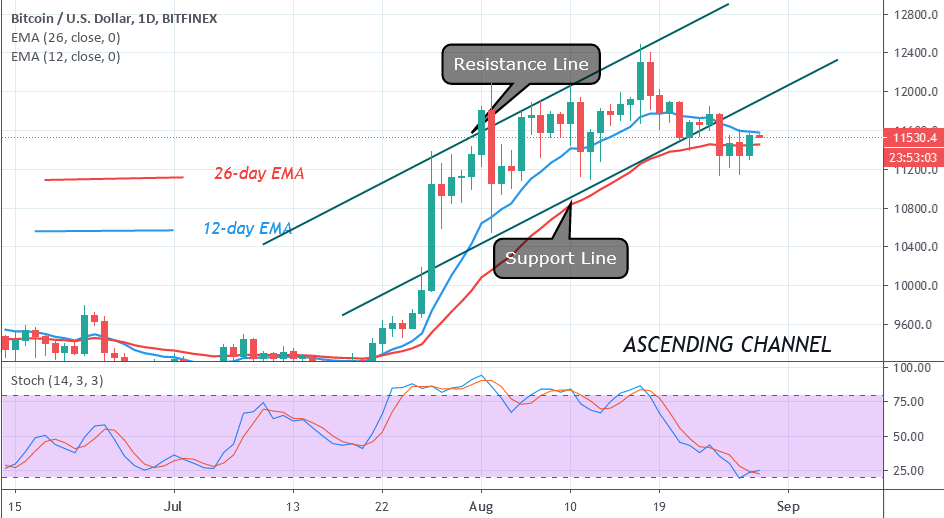
BTC/USD Major Trend: Bullish
Bitcoin has recovered twice as sellers attempted to break the next crucial support at $11,200. Buyers are facing resistance at $11,600, each time price rebounds above the $11, 200. BTC has earlier lost the $11,400 and $11,600 support levels after the bulls attempted to break above the $11,800 resistance.
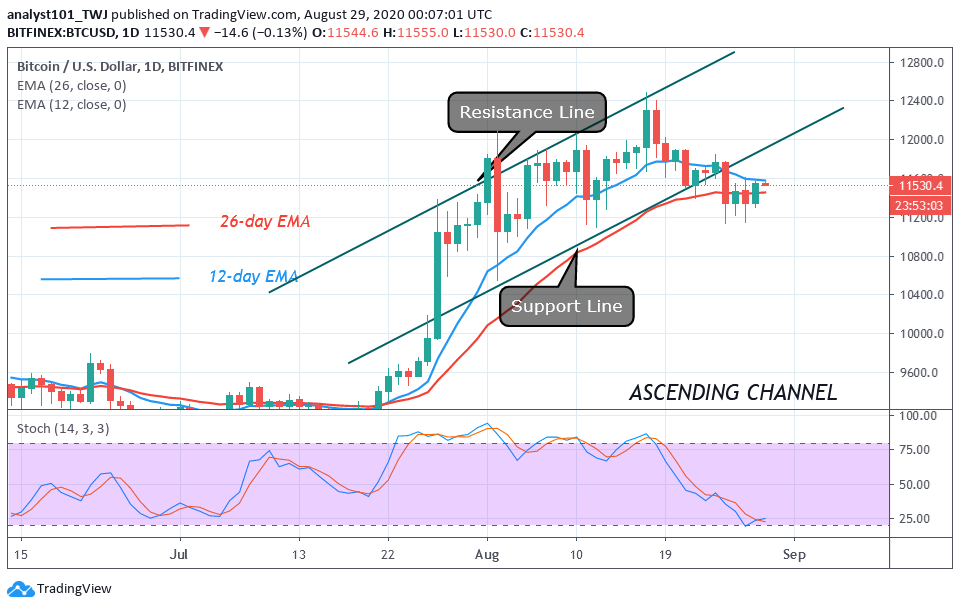
On August 28, BTC fell after being resisted at the $11, 600. For the past four days, BTC is fluctuating between $11,200 and $11,600. The king coin may break the minor resistance and rally above $12,000 if there is a repeat of August 13 price action. On August 13 price action, the king coin rebounded above $11,500, and price broke the resistances and rallied to $12,400. Conversely, if the bears succeed in breaking below $11,200, BTC will decline or plunge to $10,400.
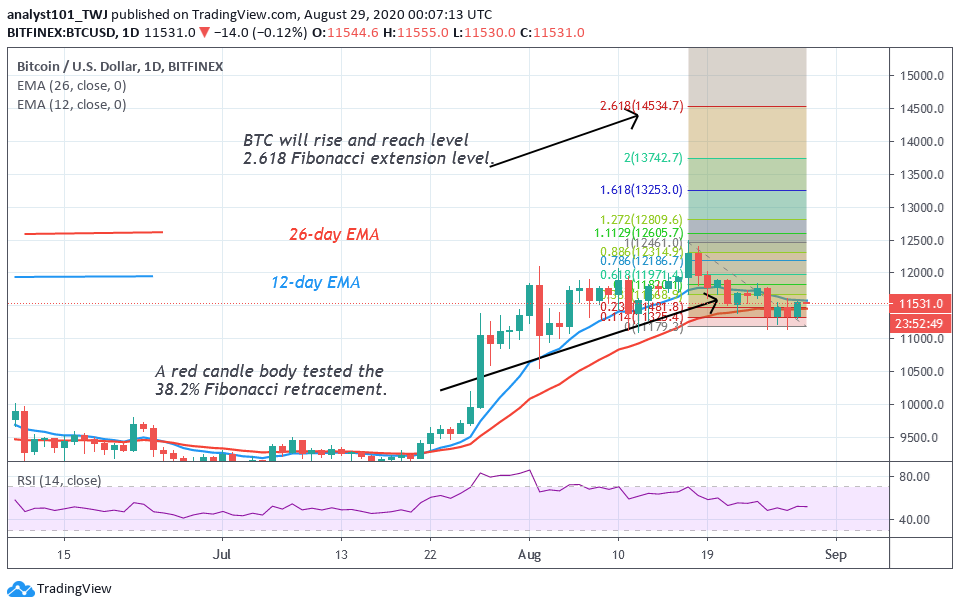
Meanwhile, on August 17 uptrend, BTC was resisted at the $12,400 high. A retraced candle body tested the 38.2% Fibonacci retracement level before price was corrected upward. This implies that when BTC resumes uptrend, the market will reach a 2.618 Fibonacci extension level. In other words, BTC will reach a high of $14,500.
ETH/USD Major Trend: Bullish
Today, Ethereum is trading above the $380 support at the time of writing. The biggest altcoin has recovered thrice above the $380 support after the bears attempted to sink the coin below the support. Ethereum bulls buy the dips, each time there is an overwhelming selling pressure at the next crucial support at $380. The upside momentum is hampered because of the resistance at $400. Ether is trading now below the $400 resistance.
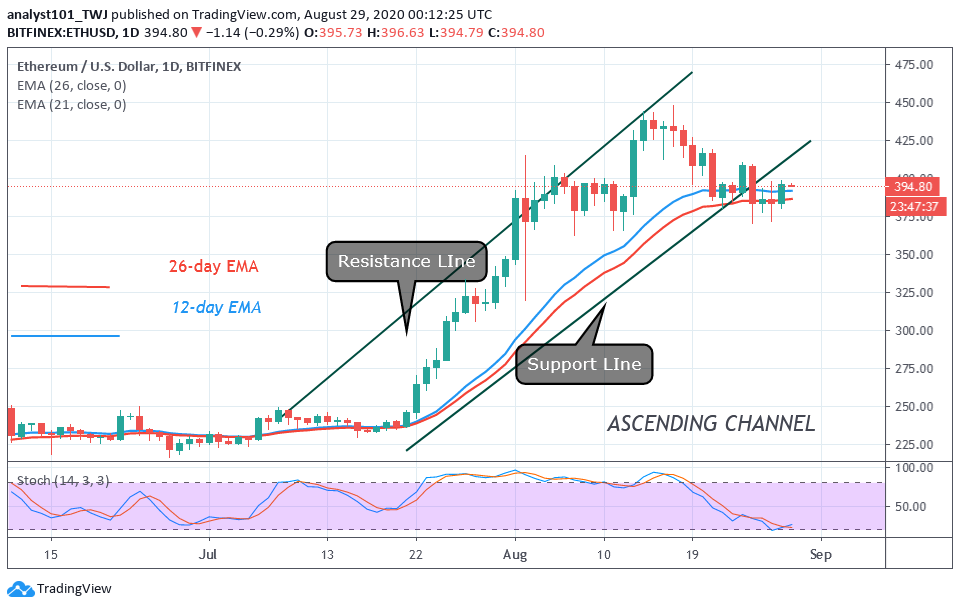
On the upside, if price rebounds above $390, the momentum will propel price to break the $400 and $420 resistance. Also, it will extend to retest the $440 overhead resistance. Eventually, if the $440 resistance is breached, ETH will reach another high of $480. Conversely, if the price breaks the $380 support and the selling pressure is sustained, ETH will sink to $366 low. Meanwhile, the bulls are in control of price at the time of writing. Ether has fallen below a 20% range of the daily stochastic. This suggests the market has reached the oversold region and buyers are likely to emerge.
XRP /USD Major Trend: Bullish
Ripple has fallen to $0.27 low after the bears broke the $0.28 support. XRP has been having a running battle since August 2 when the $0.28 support was first tested. On August 25, the bears finally broke the $0.28 support as price reached the $0.27 low. The price was corrected upward and retested the $0. 28 high before it dropped to $0.26. Today, XRP is trading at 0.271 at the time of writing.
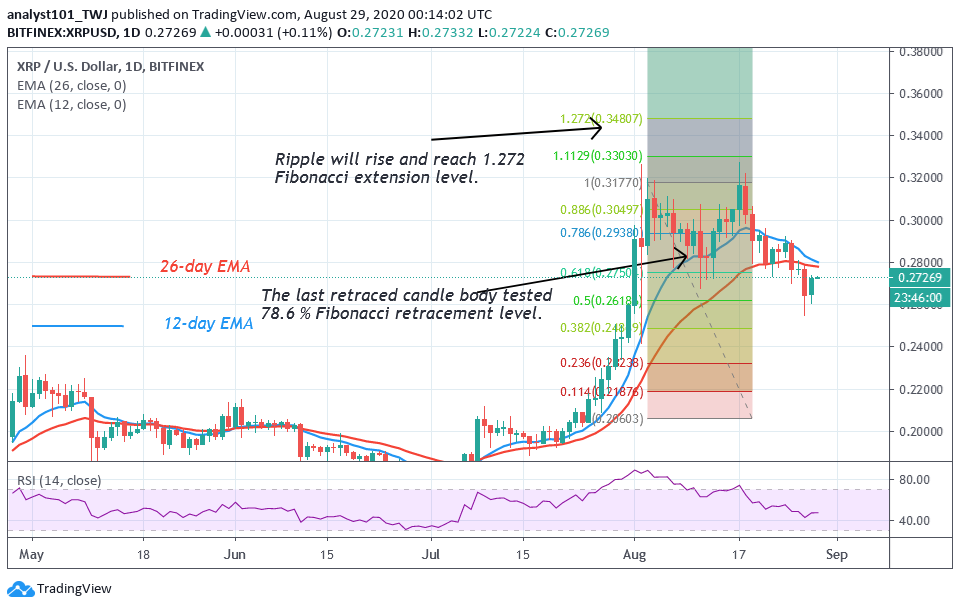
Meanwhile, on August 3 uptrend; XRP was repelled at the $0.32 resistance. Subsequently, the retraced candle body tested the 78.6% Fibonacci retracement. The implication is that Ripple will rise and reach the 1.272 Fibonacci extension level or the $0.36 high. XRP is at level 42 of the Relative Strength Index period 14. It indicates that the coin is in the bearish trend zone and below the centerline 50. Ripple has a tendency to fall.
BCH /USD Major Trend: Bullish
Yesterday, Bitcoin Cash slumped to $260 low but made an upward correction. The correction was short-lived as it was repelled at the $270 high. BCH price has resumed a downward move. In the Interim BCH will be trading between $260 and $280 price level. Upside momentum is possible if the bulls break above the EMAs or $280 high. On the other hand, if the bears break the $260 support, BCH will fall to $240.
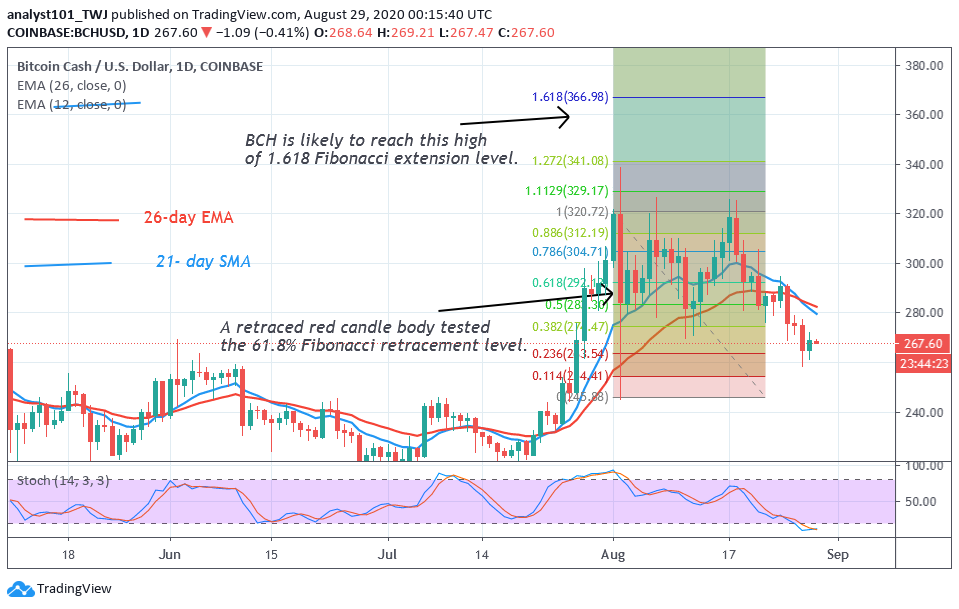
Nonetheless, on August 2 uptrend, the coin was resisted at the $320 high. However, the retraced candle body tested the 61.8 % Fibonacci retracement level. With the retracement, the market will rise to 1.618 Fibonacci extension level or the $360 high.


