Cryptos Price Analysis (September 19 – September 25, 2020): BTC, ETH, XRP, and BCH
This week the coins are making impressive moves to recover from last week’s breakdown of the crypto currency markets. Bitcoin and Ethereum have broken into the bullish trend zones. Buyers are attempting to push above their respective resistance levels. Once the resistances are cleared the upside momentum will resume. Ripple and Bitcoin Cash are still in the bearish trend zone. The bulls are making frantic efforts to break into the bullish trend zones.
BTC/USD Major Trend: Bullish
On September 13, BTC rebounded above the $10,200 support to break the resistances at $10,500 and $10,600. The price momentum extended to break the $10,800 but could not break the $11,000 resistance sufficiently. Breaking the $11,000 adequately will mean the resumption of upside momentum. Initially, price broke the $11,000 to reach a high of $11,100 but pulled back immediately. The price retraced to $10,800 support and has been fluctuating below the $11,000 high for the past three days.
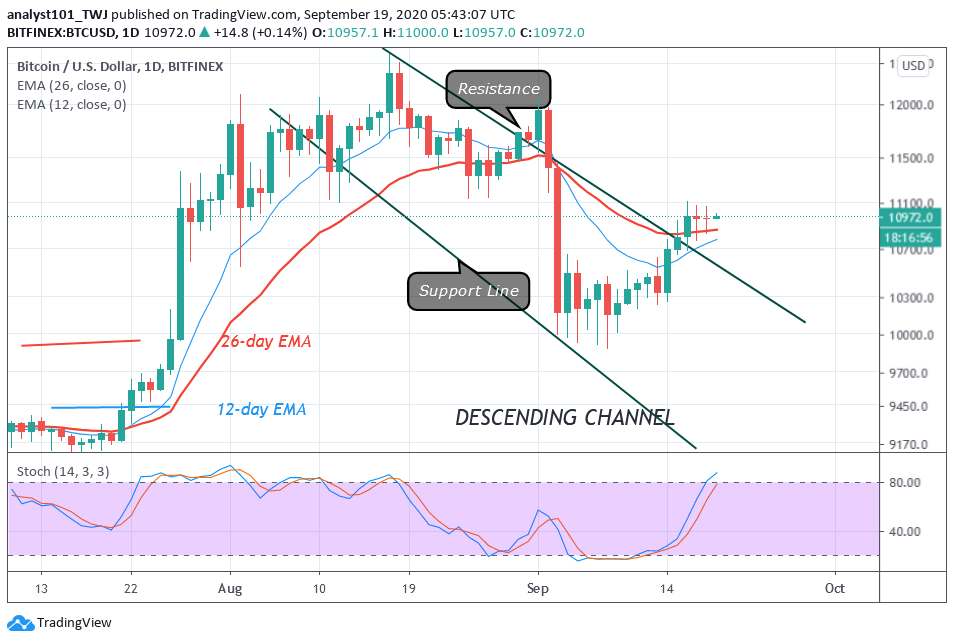
Today, BTC is trading at $10,987 at the time of writing. The current price level is above the EMAs which suggests a further upward movement of the coin. The uptrend will depend on price breaking the $11,000 resistance.
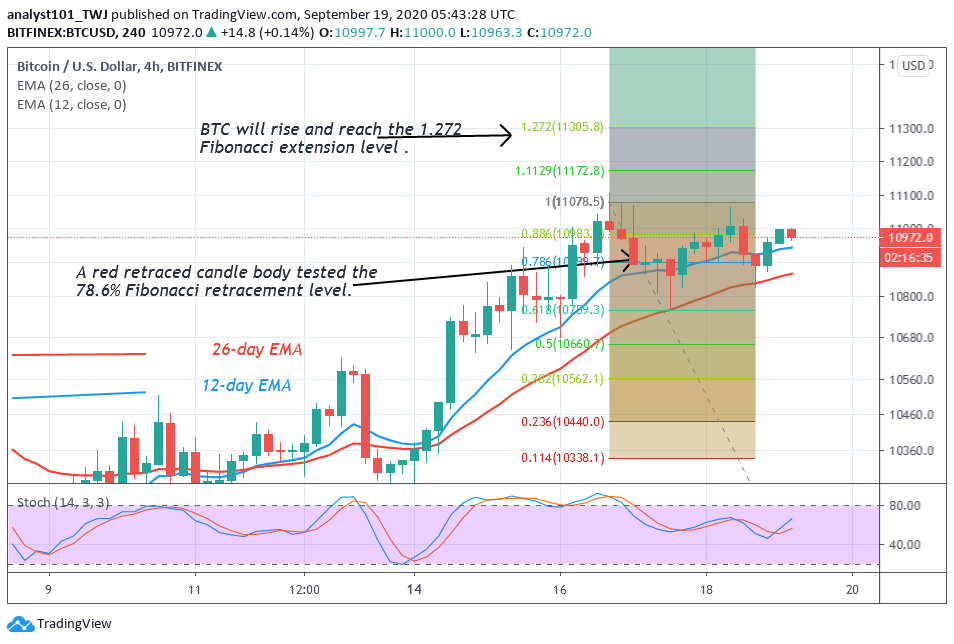
On September 16 uptrend, BTC was resisted at $11,100 high and the retraced candle body tested the 78.6% Fibonacci retracement level. At that level, the market will rise and reach the 1.272 Fibonacci extension level or $11,300 high. Nonetheless, the BTC price will reverse to the 78.6% retracement level where it originated. However, the reversal will not be immediate.
ETH/USD Major Trend: Bullish
During the week under consideration, Ethereum bulls have been struggling to break above the $390 resistance. The resistance zone has been tested thrice without a breakout. On two occasions the price fell to the $360 low and resumed upward. Buyers could have pushed price above the resistance if the coin has rebounded above the $360 support. The momentum will propel price to break the resistance level.
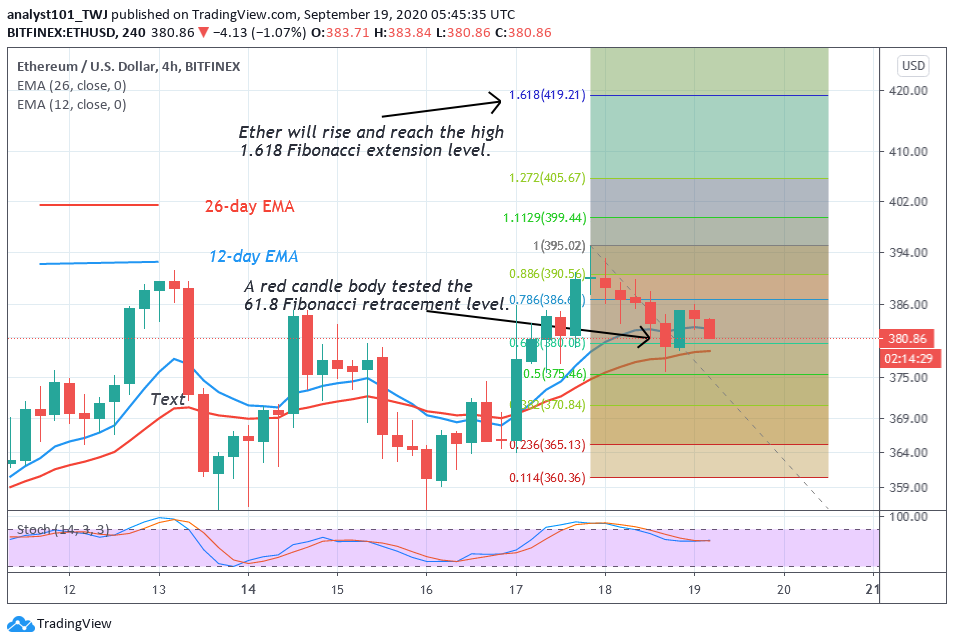
Today, Ether is falling and trading at $383 at the time of writing. There are chances of Ethereum moving upward as the price is above the EMAs. On September 17 uptrend; the retraced candle body tested the 61.8% Fibonacci retracement level. This explains that there is a possible rise of ETH to a high of 1.618 Fibonacci extension level or a high of $420. Meanwhile, a break above the resistance will accelerate price movement.
XRP /USD Major Trend: Bearish
Previously, Ripple has been on a downward move. Earlier on, the price has been making a series of lower highs and lower lows. This week the price is making a lower high as the market reached a high of $0.25. Buyers could not break above the $0.25 high after two attempts.
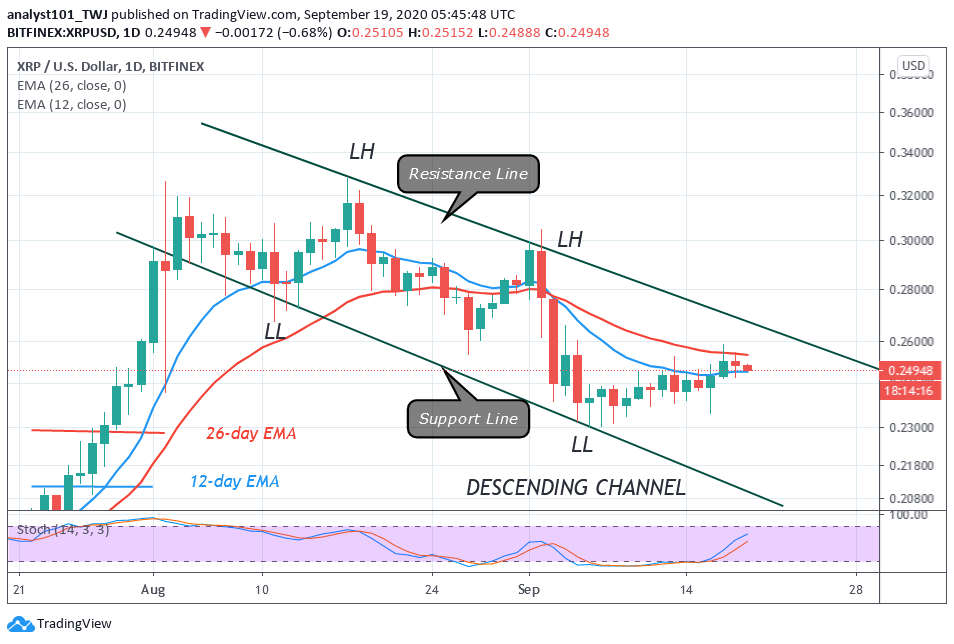
XRP has been repelled as price reached a low of $0.24. However, buyers are trying to push the price upward. On the upside, if the bulls fail to break above the lower high, the downtrend will resume. In other words, if the price fails to break above the resistance line of the descending channel, the selling pressure will continue. In the meantime, Ripple is facing rejection at the $0.25 resistance. The crypto is likely to fall to the $0.23 low.
BCH /USD Major Trend: Bearish
Bitcoin Cash has been consolidating in a tight range between $230 and $240. The tight consolidation becomes necessary as buyers fail to break the $240 resistance. This development will result in a breakdown or a breakout of price movement.
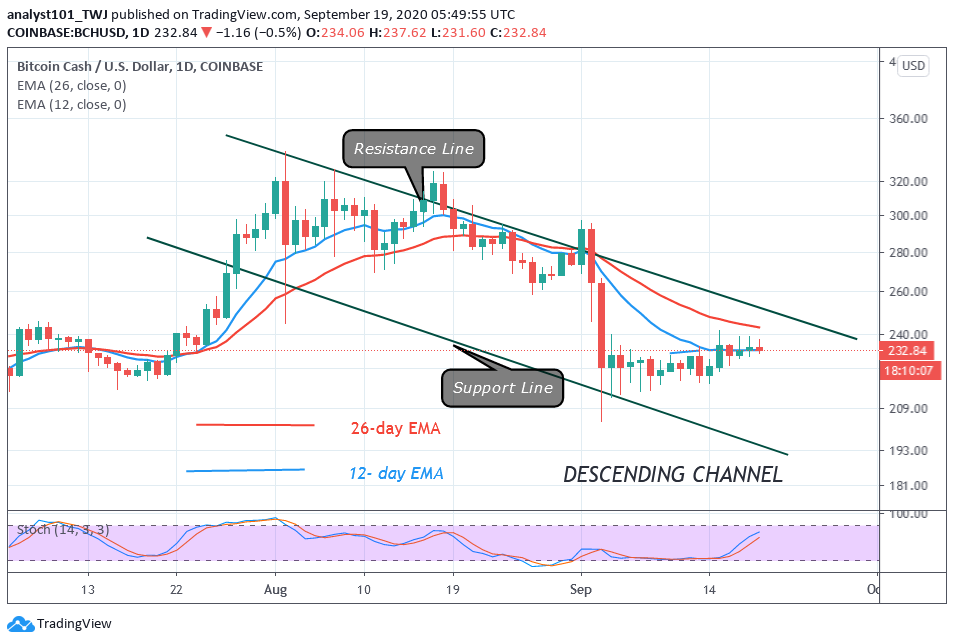
BCH will resume an upside momentum if price breaks the $240 resistance. A breakout will propel price to reach a high of $260. At that level, the coin will be in the bullish trend zone and the uptrend will resume. Conversely, if the bears break below the $230 support, the market will probably reach a low of $215. Subsequently, price will retest the critical support at $200.
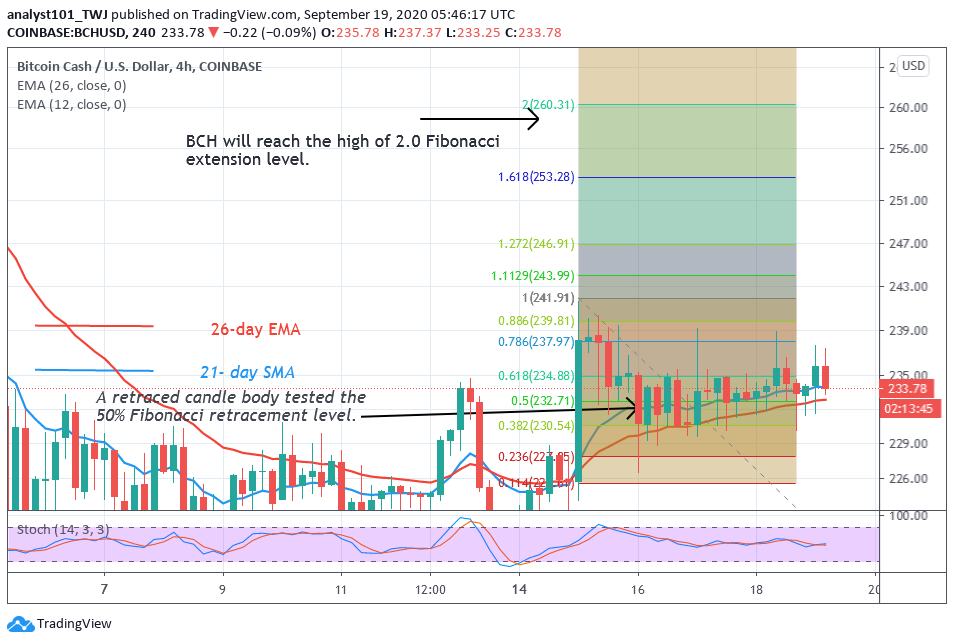
Nonetheless, there is an indication that the coin may resume an upside momentum. On September 15 uptrend, buyers pushed the coin to the high of $241 but could not sustain the uptrend. The retraced candle body tested the 50% Fibonacci retracement level. This gives the impression that the market will reach the 2.0 Fibonacci extension level or a high of $260.


