

Cryptos Price Analysis (October 17 – October 23, 2020): BTC, ETH, XRP, and BCH
Bitcoin (BTC) and the three altcoins are likely to further decline as the critical support zones may be breached. Bitcoin critical support zones are yet to be broken as the coin hovers above the $11,300 support. Bitcoin Cash is already on a downward correction as the market continues its downward move.
BTC/USD Major Trend: Bullish
Presently, Bitcoin is consolidating above $11,200 support after its failure to break the $11,500 and $11,700 resistance level. Bitcoin bulls partially broke levels but could not sustain the upward move. For the past week, the king coin reached a high of $11,740 but was resisted.
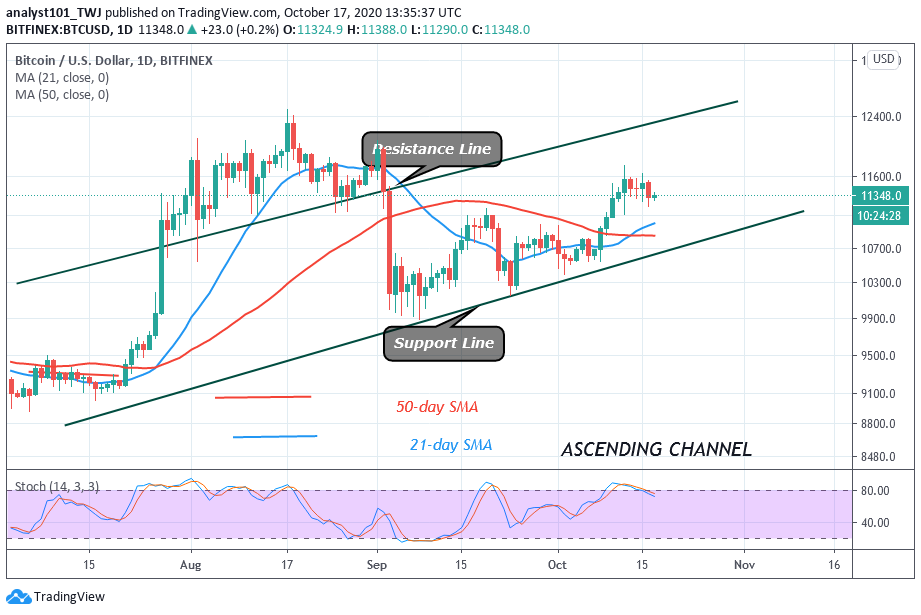
The coin has been on a downward move, but it’s consolidating in a tight range between $11,200 and $11,400. On the upside, if the critical support levels of $11,100, $11,200, and $11,300 hold, Bitcoin will resume the upside momentum. However, if these support zones are cleared by the bears, the downtrend will resume.
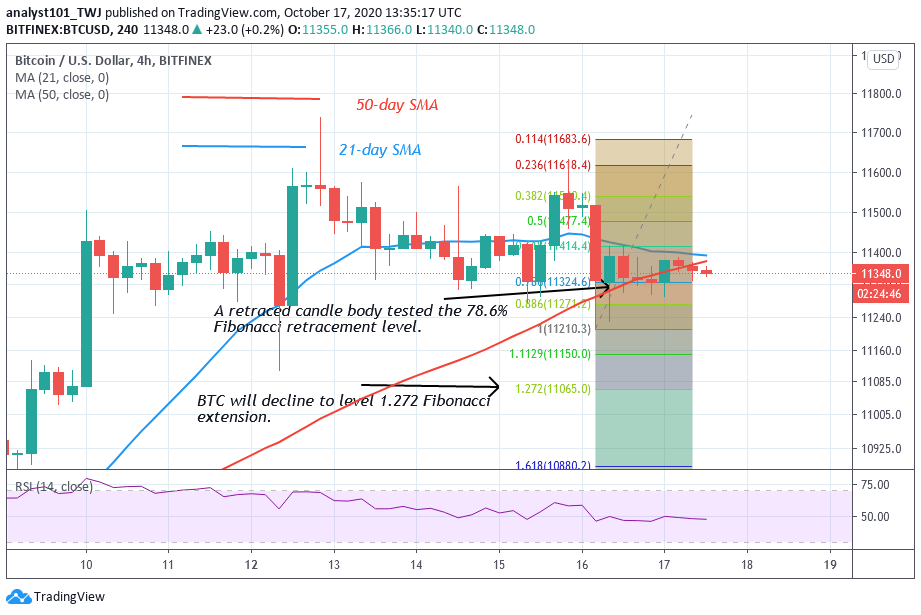
From the daily chart, the Fibonacci tool has indicated a further downward movement of Bitcoin. On October 16 downtrend, a retraced candle body tested the 78.6 % Fibonacci retracement level. This suggests that Bitcoin will fall to level 1.272 Fibonacci extension. That is a low of $11,065 price level. Thereafter, there will be a price reversal to the previous highs.
ETH/USD Major Trend: Bearish
In the previous week, buyers were making efforts to push the price above the $395 high but were unsuccessful. On October 12, the biggest altcoin was rejected at the $395 high. Consequently, Ether is on a downward move as the coin slumps to a $368 low at the time of writing.
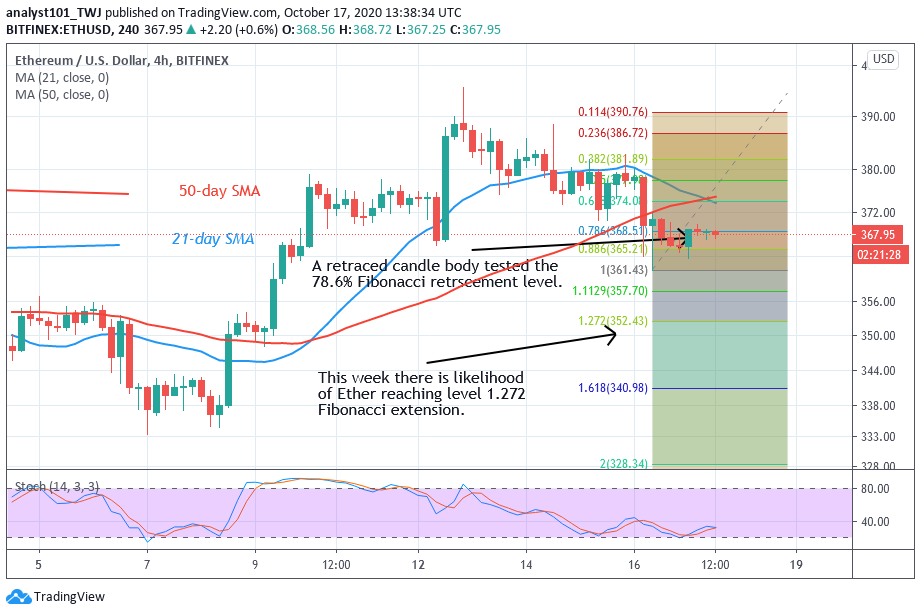
Ethereum will have another chance of upside momentum if price falls and finds support above $350. However, the selling pressure will persist if the bears break below the $350 support. On the daily chart, ETH has fallen to $364 on October 16. The retraced candle body tested the 78.6% Fibonacci retracement level. This gives the impression that the market will fall to 1.272 Fibonacci extension or the low of $352.43. At this price level, the biggest altcoin will reverse to 78.6% Fibonacci retracement where it originated.
XRP /USD Major Trend: Bearish
For the past week, Ripple has been trading below the $0.26 overhead resistance. Buyers also fail to breach the overhead resistance. On October 13, XRP was resisted as the price fell to the $0.242 low. The downward movement will persist if the bears break the $0.24 support.

This will propel the coin will further decline to the previous lows. The upward movement will resume if the current support at $0.24 holds. Possibly, if there is a strong bounce above the $0.24 support, XRP will rise and the price momentum will rally above the $0.26 resistance. Nonetheless, On October 16 downtrend, the retraced candle body tested the 78.6 % Fibonacci retracement level. This gives the impression that XRP will reach level 1.272 Fibonacci extension. That is a low of $0.238.
BCH /USD Major Trend: Bearish
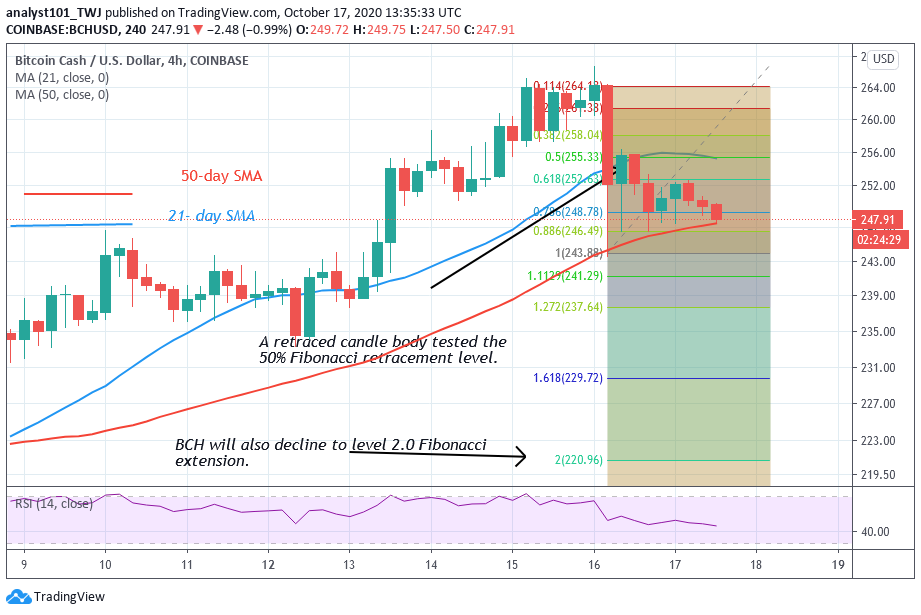
Today, the bears have broken the $250 support which signals the resumption of the downtrend. BCH is likely to fall to the lows of $243 or $238. On the other hand, if the bulls have sustained the bullish momentum above $250 support, the altcoin would have rally above $260. The uptrend would have resumed to the highs of $280 and $300. However, it appears this week the coin will continue its downward correction. Nonetheless, on the October 16 downtrend, the retraced candle body tested the 50% Fibonacci retracement level. This retracement indicates that BCH will further decline to level 2.0 Fibonacci retracement level. That is the low of $220.96


