

Bitcoin (BTC) has broken the crucial resistance levels of $12,000 and $12,460 as the coin trades above $12,900 at the time of writing. This week it is likely to trade above $13,400.The three altcoins, except Ripple, have broken their respective crucial resistance levels as the coins surged higher. Ripple is stuck below the $0.26 overhead resistance but may break this level soon.
BTC/USD Major Trend: Bullish
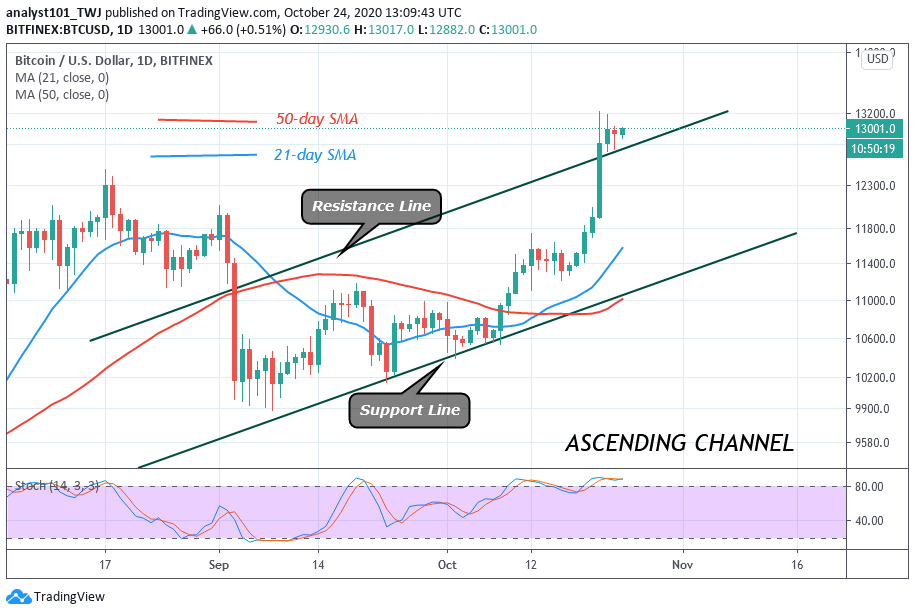
Since October 21, Bitcoin bulls have broken the $12,000 overhead resistance. The coin rebounded above $11,989 as the price breaks the $12,000 and $12,460 overhead resistance. The bullish momentum extended to a high of $13,200 but was resisted. The bulls have retested the recent high but were resisted. BTC price is now fluctuating between $12,800 and $13,200 in a tight range.

The coin will resume an uptrend if the $13200 resistance is breached. The king coin is trading at $12,989 at the time of writing. On October 22, BTC was resisted at the $13,200 resistance. The retraced candle tested the 88.6% Fibonacci retracement level. This indicates that the coin will rise to level 1.1129 Fibonacci extensions or the high of $13,448.10.
ETH/USD Major Trend: Bullish
Today, Ethereum bulls have broken the resistance at $395 as the upside momentum resumes. In the previous week, Ether has been on a downward move after facing rejection at the $395 high. The coin fell to $361 and resumed upward. The upward move faced another resistance at $380 as the coin retraced to the $365 low. On October 21, the coin rebounded twice to break the resistance at $380 and $395 highs. Expectantly, the bullish momentum is likely to continue.
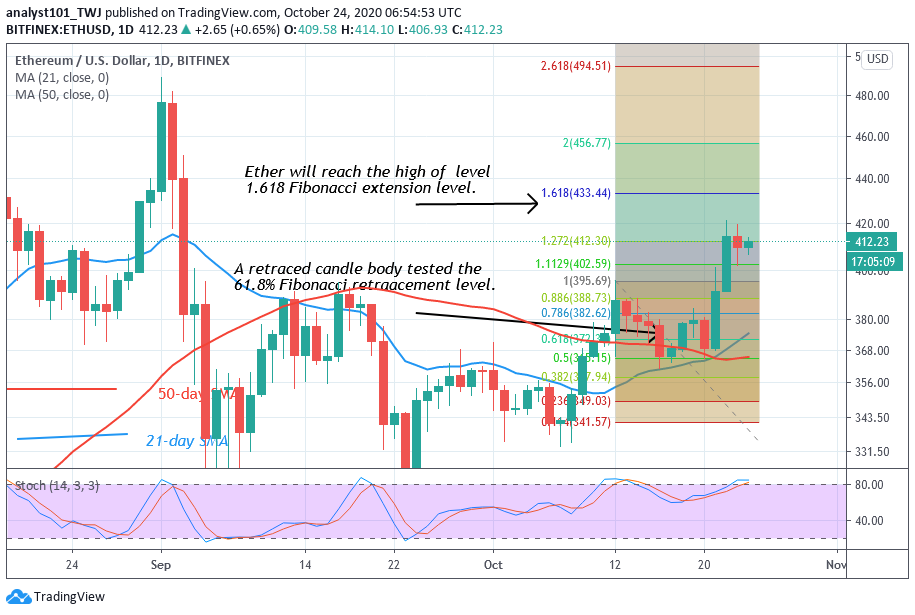
Presently, the coin is facing a minor resistance at $420 high. This week Ethereum is likely to make a further upward move once the minor resistance at $420 is breached. On October 12 uptrend; the coin was resisted as the coin slumped to $361. The retraced candle body tested the 61.8% Fibonacci retracement level. With this retracement, ETH is likely to rise to reach level 1.618 Fibonacci extension or $433.44 high. At that level, the price action will continue. The coin is likely to face another resistance at $440. A break above $440 will catapult the crypto to reach a high of $480.
XRP /USD Major Trend: Bullish
For the past two days, Ripple has been on a downward move after facing rejection at $0.26 overhead resistance. Today, the market has dropped to $0.253 at the time of writing. The bottom line is that the $0.26 overhead resistance is the major impediment to the XRP uptrend. The uptrend has been repelled thrice in October.
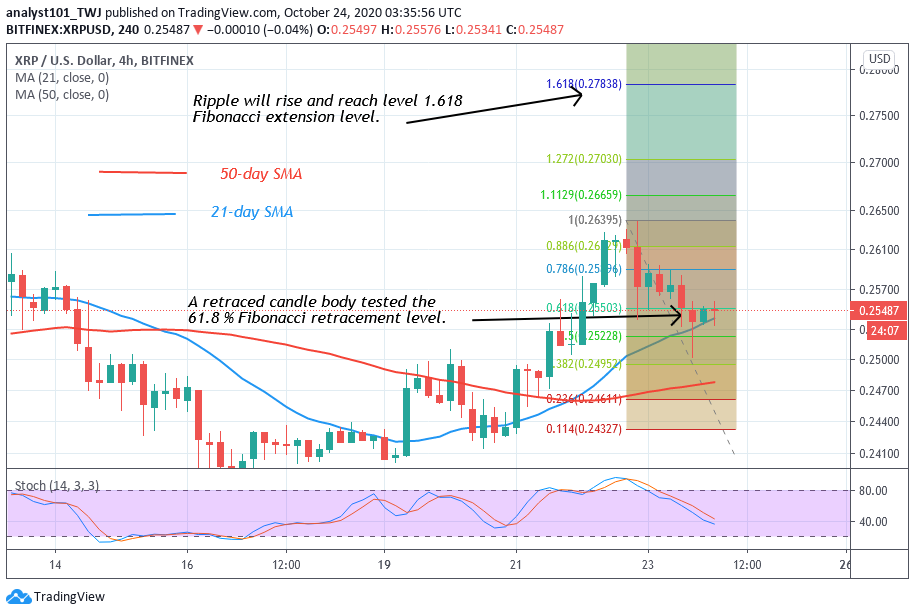
Nevertheless, the coin is falling and if it finds support above $0.24, XRP will resume a sideways move to retest the overhead resistance. On October 22 uptrend, the retraced candle body tested the 61.8 Fibonacci retracement level. This indicates that the current resistance is likely to be broken and Ripple will rise and reach level 1.618 Fibonacci extension. That is the high of $0.278.
BCH /USD Major Trend: Bullish
In the previous week, the uptrend of October 15 was repelled at $265 resistance. The coin resumed a downward move to the low at $238. On October 21, the bulls buy the dips as the coin rebounded twice to reach the high of $273. The bulls have broken above the $250 support as the price closes above it.
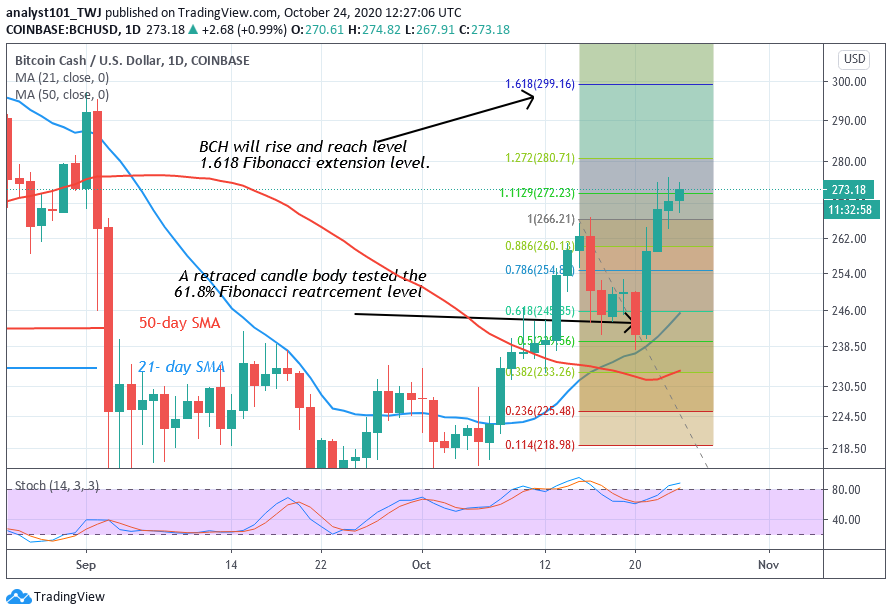
The support is critical for the resumption of upside momentum. On the upside, as price breaks the $265 resistance, BCH will rally to $280 and $300 highs. Nevertheless, on the August 15 uptrend, the last retraced candle body tested the 61.8 % Fibonacci retracement level. This implies that the coin will further rise to level 1.618 Fibonacci extension. In other words, BCH will rise to a high of $299.16 .


