

Bitcoin has continued to rise as it approaches the high of $14,000. Analysts believed that the fallen U.S dollar has aided its recent rise. Presently, BTC is battling to break above the $14,000 resistance. The other altcoins were in a downward move the previous week. Today, the cryptos are recovering after falling to their respective support levels.
BTC/USD Major Trend: Bullish
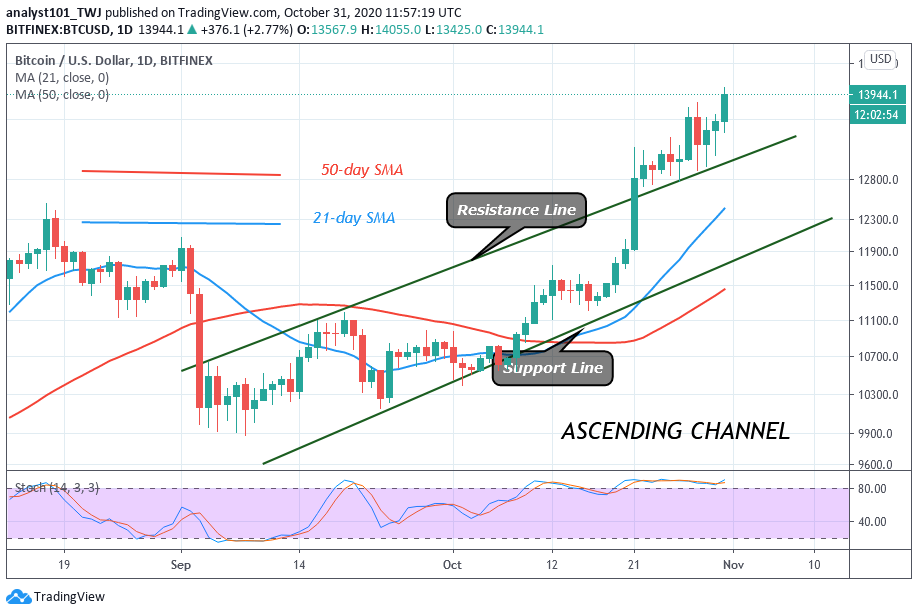
For the past week, Bitcoin bulls have been battling to resume the upside momentum by clearing the resistance level of $13,300. The bulls succeeded as BTC rallied to $13,800. Consequently, there was a bearish reaction as the coin plunged back to the $13,060 low. Buyers pushed the price upward but were repelled at the $13,600 resistance. After the resistance at the recent high, BTC was confined between $13,060 and $13,600 for three days. Today, the coin rebounded twice to break the resistance at $13,600 and $13.800. After breaking these resistances, BTC rallied above $14,055 high.
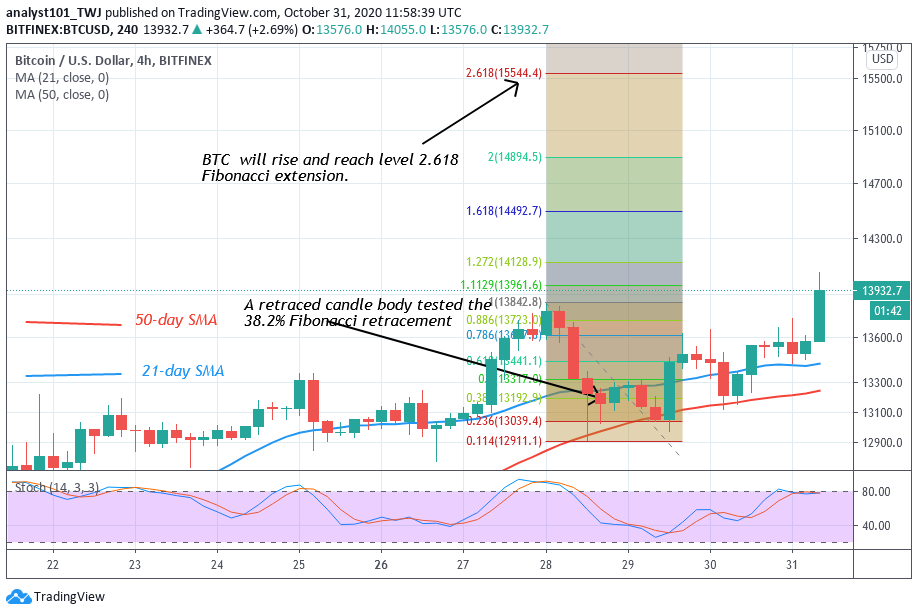
This week, the Fibonacci tool has indicated a further upward movement of the coin. On October 28 uptrend, BTC was resisted at $13,839. The retraced candle body tested the 38.2% Fibonacci retracement level. This retracement indicates that the crypto will rise and reach level 2.618 Fibonacci extension or $15,544.20 high.
ETH/USD Major Trend: Bullish
In the previous week, Ethereum was in a downward move as a result of rejection at the $420 overhead resistance. The coin retraced to the low at $374 and rebounded above the current support. The biggest altcoin has escaped a further decline below the critical support at $380. The upside momentum will resume if the critical support holds. The support is holding as price reaches a high of $388 at the time of writing.
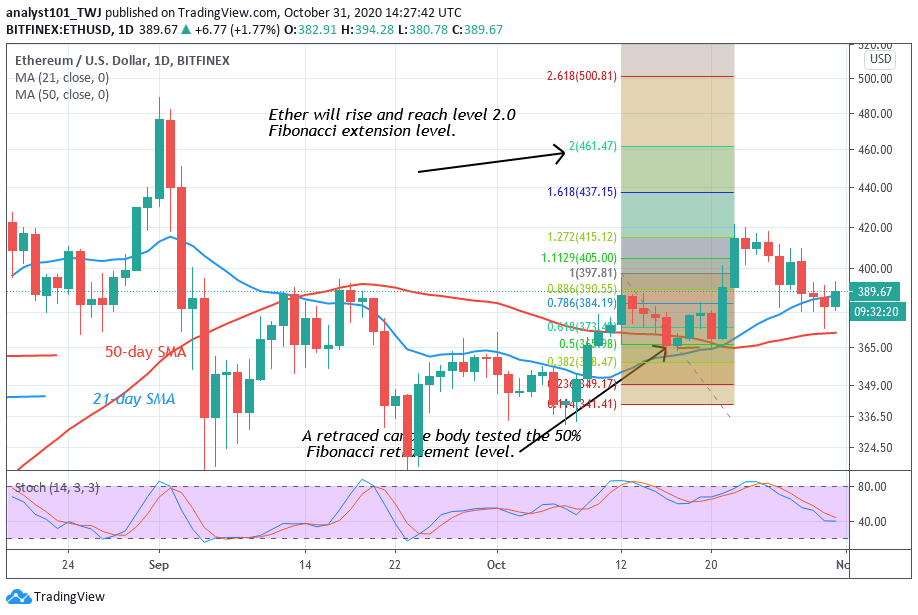
On the upside, if buyers push the price upward, a retest at the $420 resistance is likely. Perhaps a break above $420 will propel BCH to reach a high of $488. Meanwhile, on October 12 uptrend; the retraced candle body tested the 50% Fibonacci retracement level. This indicates that the market will reach a high of 2.0 Fibonacci extension or $461.47 high.
XRP /USD Major Trend: Ranging
Ripple is range bound between $0.23 and $0.26 since October 5. The bulls and bears are yet to break the key levels of the range-bound zones as the coin continues its consolidation. In the previous week, XRP fell towards the lower price range. On October 30, XRP dropped to a $0.2305 low and rebounded. A s the coin bounces, the sideways move between $0.23 and $0.26 will resume. Buyers will attempt to push XRP to the $0.26 resistance.
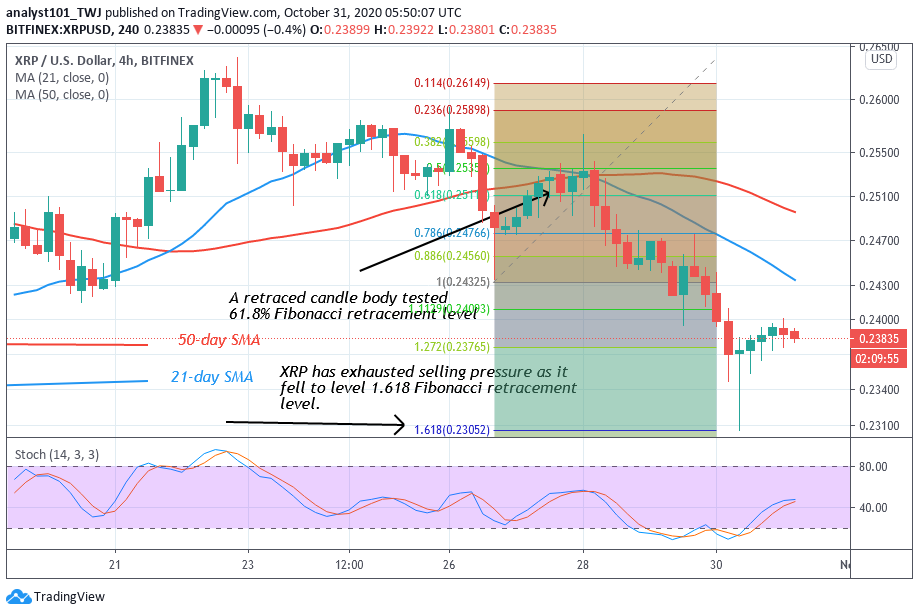
Perhaps a retest at the $0.26 resistance is possible. A breakout at $0.26 will accelerate the price movement to a $0.30 high. Nevertheless, during the downtrend, the Fibonacci tool was employed. On October 26 downtrend; the retraced candle body tested the 61.8% Fibonacci retracement level. This implies that XRP will decline to level 1.618 Fibonacci extensions or $0.2305 low. Ripple has already retested the support at $0.2305 and move up.
BCH /USD Major Trend: Bullish
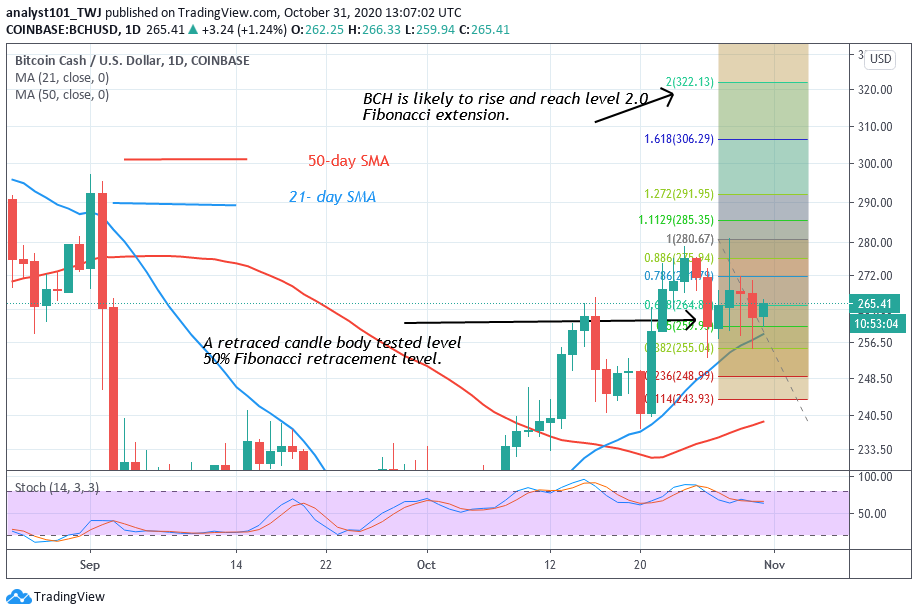
Bitcoin Cash plunged to a $252 low while buyers were attempting to push BCH above the $280 resistance. On October 27, BCH recovered from the downtrend and above the $250 support. Above this support, the upside momentum will resume as the price rises to retest the $280 overhead resistance. As BCH resumes upside momentum, a rebound above the current support will propel the price to break the resistance at $280 and the momentum will extend above the $300 high. Meanwhile, this week BCH is likely to rise. On October 24 uptrend, BCH was resisted at $280. The retraced candle body tested the 50% Fibonacci retracement level. This implies that BCH will rise to level 2.0 Fibonacci extension. That is the high of $322.13.


