This week the cryptos under review attained peak prices but could not break their respective resistance levels. Consequently, the coins suffered a bearish reaction. The coins retraced to their previous lows and resumed a fresh uptrend. Today, the price action is showing bullish signals indicating an upward movement of prices.
BTC/USD Major Trend: Bullish
In a nutshell, Bitcoin (BTC) is trading above $11,550 at the time of writing. In the August 1 uptrend, the king coin reached the $12,000 high and was resisted. The retraced candle body tested the 78.6% Fibonacci retracement level. This indicates that the market will rise and reach 1.272 Fibonacci extension level or the $12,400 high. The king coin traded and reached that level but buyers faced a bearish reaction.
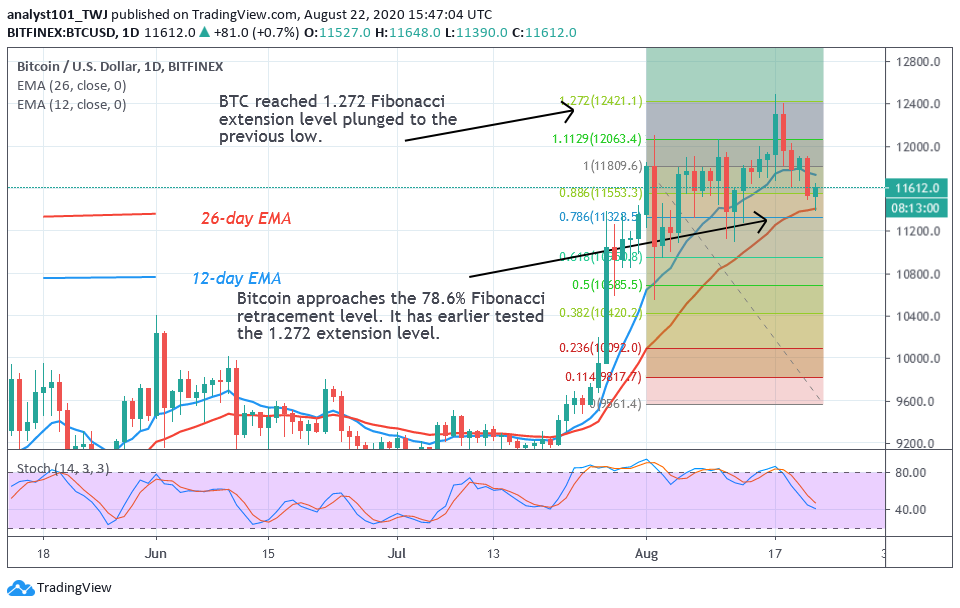
Bitcoin dropped sharply from the recent high. In the Fibonacci tool rule, if a coin reached 1.272 extension level; it must return to the 78.6% retracement level where it originated. Bitcoin has returned to the Fibonacci level as indicated by the arrow. Today, price action is showing bullish signals indicating that the selling pressure has subsided. The price is testing the crucial support level of Bitcoin. The market will tend to rise when price holds above $11,400 to $11,600 support levels. Bitcoin will resume a fresh uptrend to retest the $12,000 overhead resistance.
ETH/USD Major Trend: Bullish
Ethereum has retraced from the recent high of $440 to $380 low as bulls resumed upward move. This has been confirmed by the Fibonacci tool. A red candle body tested the 78.6% Fibonacci retracement level. It indicates that Ether will reach the high of 1.272 extension level and reverse to the 78.6% retracement where it originated. The price action is now showing bullish signals above the $380 support.
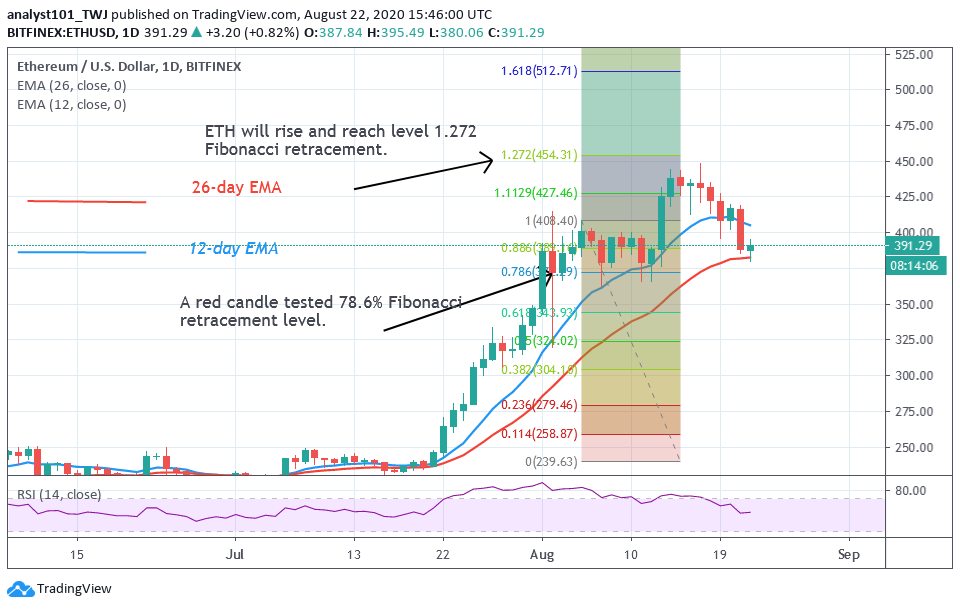
The current support has been holding since August 1. On the upside, a strong bounce above the current support will propel price to retest the $440 resistance level. The biggest altcoin has the chance for a further upward move if it breaks the current resistance. The market stands the chance of reaching a high of $480 if the resistance is cleared. Otherwise, Ether will be compelled to a sideways move below the resistance. The coin is in the uptrend zone as it is at level 53 of the Relative Strength index.
XRP /USD Major Trend: Bullish
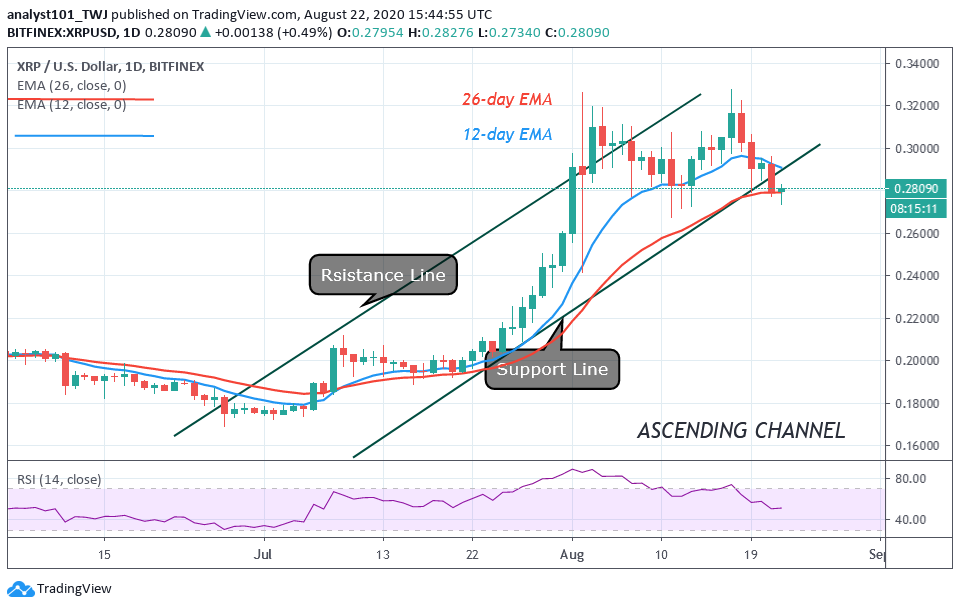
Today, Ripple is trading above $0.28 support after the recent downward move. The recent downward move was as a result of the formation of a bearish double top. Technically, this pattern formation is a bearish signal that causes the coin to fall. XRP has fallen to $0.28 support as the price action indicates bullish signals. The current support level is likely to hold as it has been holding since August 1. The coin will resume an upward move if the current support holds. If price rebounds above $0.28, it will retest the $0.32 high, and the momentum will extend to $0.43 high.
BCH /USD Major Trend: Bullish
Bitcoin Cash has fallen to the crucial support level at $280 but the coin is trading at $285. The bottom line is that buyers have been unable to break the resistance at $320 since August 1. Consequently, BCH was compelled to a sideways move as they attempt to break the $320 resistance.
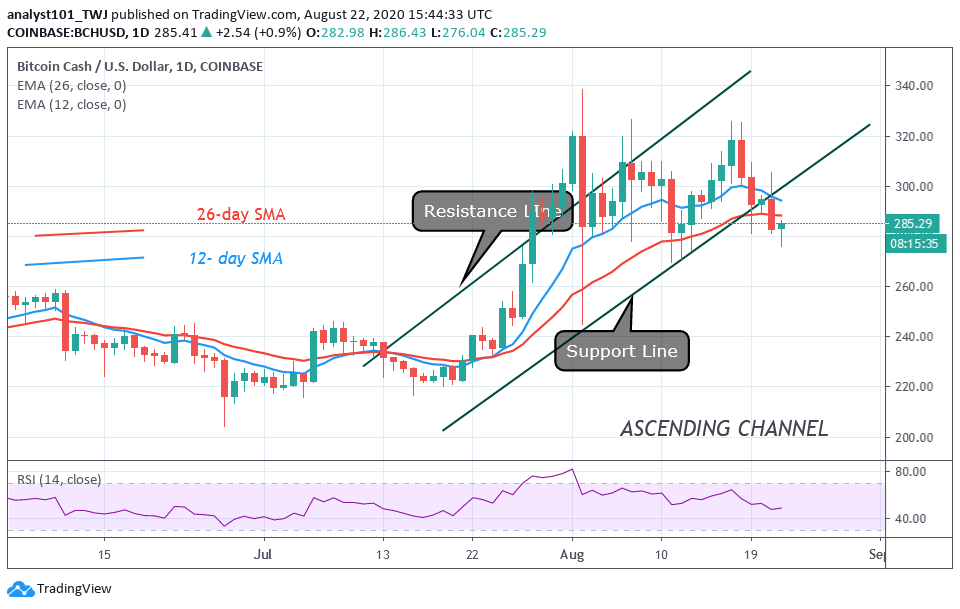
On every retest at the resistance, the market will fall to the $280 support level. Today, the price action as shown bullish signals which means the market will move up. Buyers have two hurdles to jump over if BCH rebounds above the $280 support. The bulls will jump over the resistances at $320 and $340. BCH will reach the target price of $380 high if the bulls are successful. The market will continue its consolidation between $280 and $320 if the bulls fail to clear the resistances.


