
Bitcoin (BTC) has been stalled below the $35,000 resistance for the past 48 hours. The king coin is likely to decline as the bullish price movement dries up at the resistance zone. Bitcoin lacks buying power at higher price levels. The crypto’s underlying strength has been weakened. The altcoins namely Ripple, Polkadot, Litecoin, and Chainlink have revisited their respective previous lows and now in a downward correction.
BTC/USD Major Trend: Bearish
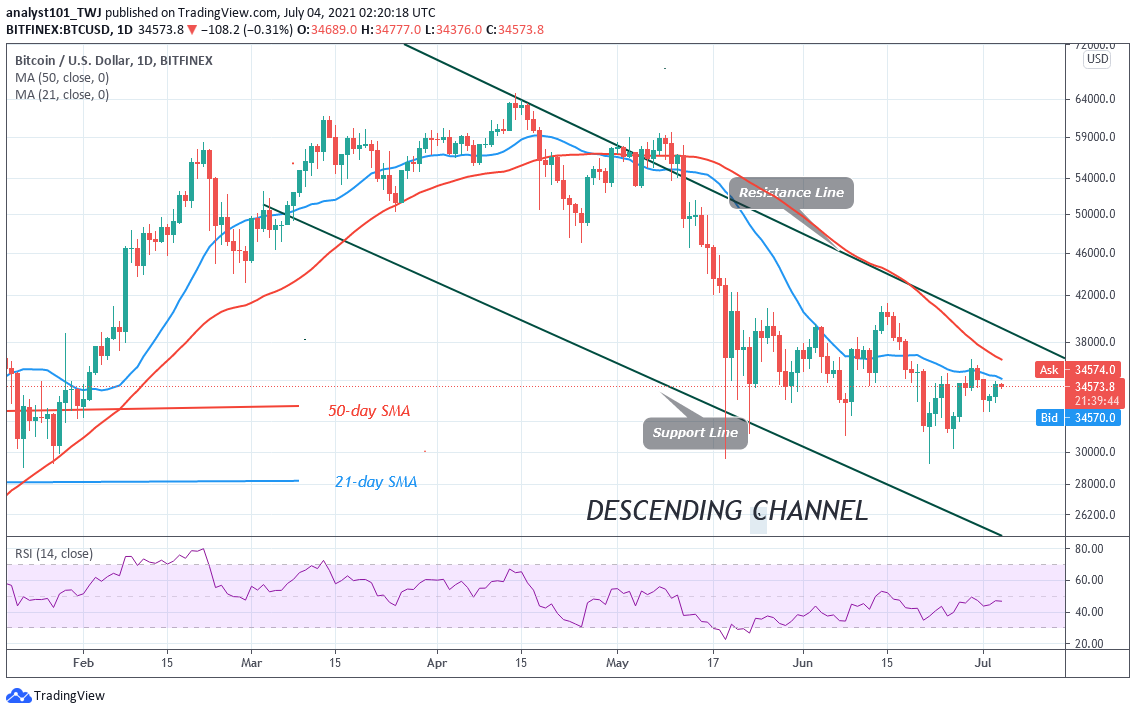
Bitcoin’s (BTC) price has been stalled below the $35,000 resistance level. Since May 19, the king coin has been range-bound between $31,000 and $41,273 price levels. However, since June 21, BTC/USD is now confined in a tight range between $31,000 and $35,000. The crypto’s upward move has been constrained below $35,000 high as buying dries up at the resistance zone. For example, today buyers are struggling below the $35,000 resistance to break above it. If they are successful above the resistance zone, Bitcoin will rise to retest the $41,273 high.
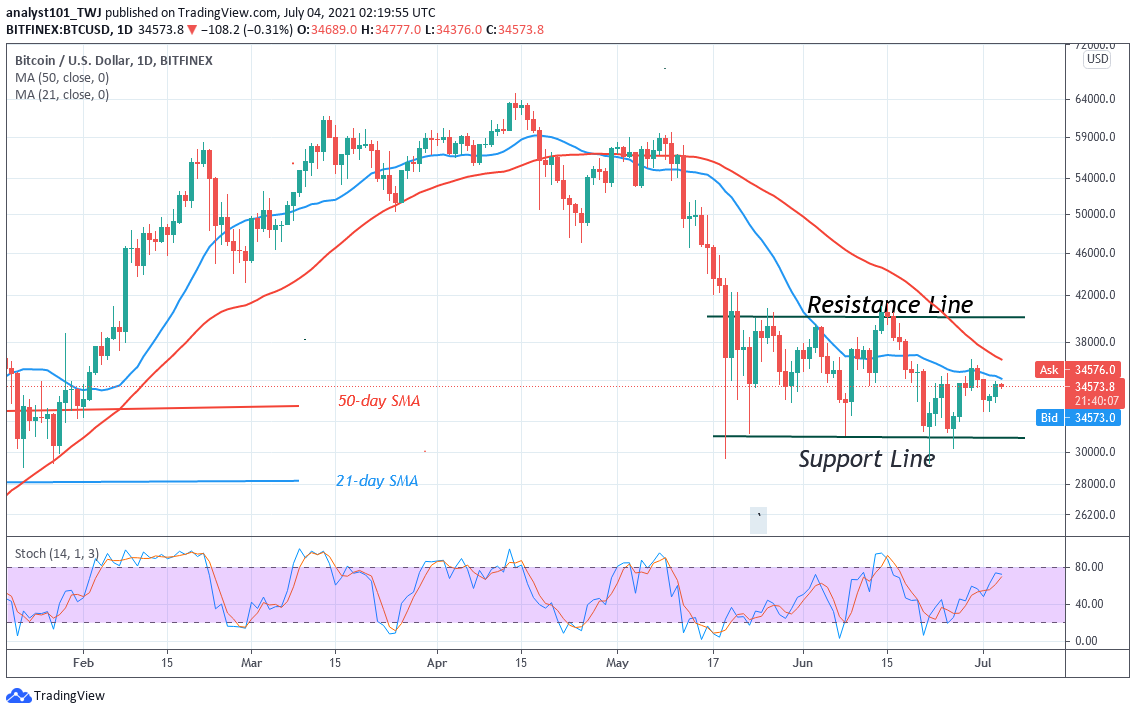
On the other hand, if Bitcoin faces rejection, the market will decline to the $31,000 support. Nonetheless, at other times, if price breaks below the $31,000 support, the BTC price will break below the $30,000 as bulls buy the dips. This has been the price scenario since May 19. On the upside, Bitcoin will resume upside momentum if the bulls clear the $40,000 to $41,273 resistance zones.
XRP/USD Major Trend: Bearish
On June 22, Ripple’s (XRP) price reached bearish exhaustion as the market declined to the low of $0.51.The bulls bought the dips as the market reached the high of $0.73. The bulls failed to sustain the bullish momentum above the recent high. XRP is also facing rejection at the 21-day SMA.

On the upside, if the bulls break the recent high, Ripple will revisit the previous highs of $0.96 and $1.10. Conversely, if XRP faces rejection from the recent high, the crypto will fall and find the next support at $0.51. However, if the bears break the $0.51 support, Ripple will decline to $0.35 low. Meanwhile, on May 23 downtrend; a retraced candle body tested the 78.6% Fibonacci retracement level. The retracement indicates that XRP price will fall to level 1.618 Fibonacci extension or level $0.355.
DOT/USD Major Trend: Bearish
Polkadot (DOT) price is hovering above the previous low of $13.09. On June 22, the DOT price plunged to $13.09 low as bulls bought the dips. The market rose to $17 and resumed a range-bound move between $13 and $17. In this price action, the range-bound levels are likely to be broken and Polkadot will either trend upward or downward.

On the upside, if the bulls break the $17 high, the DOT price will rise to $26.50 high. On the downside, if the bears break below the $13 support, the DOT price will decline to $10.50 low. Meanwhile, on July 2 downtrend, a retraced candle body tested the 50% Fibonacci retracement level. The retracement indicates that DOT price will fall to level 2.0 Fibonacci extension or level $12.89. From the price action, the market has declined to $15.29 at the time of writing.
LTC /USD Major Trend: Bearish
On June 22, LTC/USD plunged to $105.78 low as bulls bought the dips. The bears were able to break the previous low at $118.50. However, the bulls pushed the LTC price above the previous low but faces rejection at the $138 high. The upward move was terminated at the 21-day SMA. If the bulls fail to sustain above the recent high, the selling pressure is likely to resume.
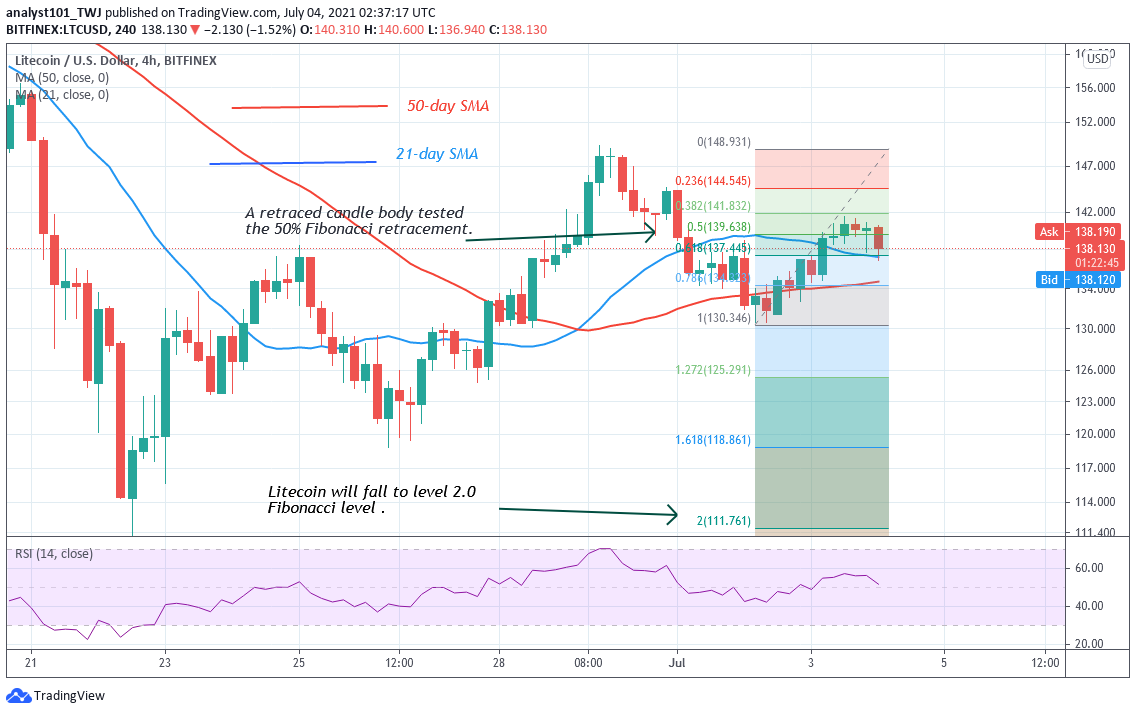
The market will rise to the previous high of $180 or $200 if buyers breach the recent high. Conversely, Litecoin will fall and find support above $105.78 if the selling pressure resumes. Meanwhile, on July 2 downtrend; a retraced candle body tested the 50% Fibonacci retracement level. The retracement indicates that Litecoin is likely to fall to level 2.0 Fibonacci extension or level $112.13. The market is declining and has reached a low of $138.94.
LINK /USD Major Trend: Bearish
Chainlink (LINK) price plunged to the previous low at $15.07 on June 22. The bulls bought the dips as buyers pushed the altcoin to the high of $20. For the past week, the crypto has been fluctuating between $16 and $20. However, the price fluctuation has not gone beyond the current range.

The $15 support has been holding since January 2021. Presently, the coin is falling and most likely to revisit the previous low at $15.On the upside, if the bulls break the $20 high, the crypto will rise to retest the $26 resistance. Meanwhile, on July 2 downtrend; a retraced candle body tested the 61.8% Fibonacci retracement level. The retracement indicates that the LINK price will fall to level 1.618 Fibonacci extension or level $15.17. From the price action, the market has declined to $18.29 at the time of writing.


