
Bitcoin (BTC) is still in a downward correction since May 19. Buyers and sellers have been in price tussle between $30,000 and $40,000 price levels. Bitcoin will trend if these range-bound levels are breached. The three altcoins namely Litecoin, Polkadot, and Chainlink have recovered from downtrends but are in a downward correction.
BTC/USD Major Trend: Bearish
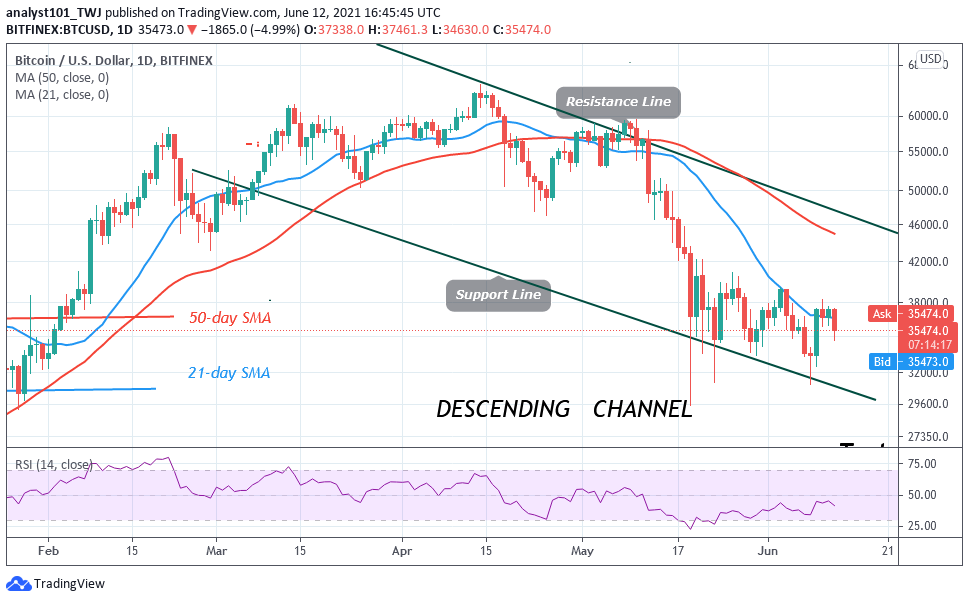
Today, BTC’s price has been fluctuating above the $35,000 support. For the past week, Bitcoin has fluctuated between $30,000 and $39,000 price levels. The bears had intended to break the $30,000 support, This will propel BTC price to fall to $28,000 or $20,000 low. Nonetheless, the bulls have consistently defended the $30,000 support as Bitcoin hovers above the $35,000 price level. On the upside, if the bulls break the $39,000 resistance, BTC price will rally above $40,000 high. Incidentally, if the $40,000 resistance is cleared, a rally to $46,000 high is possible.
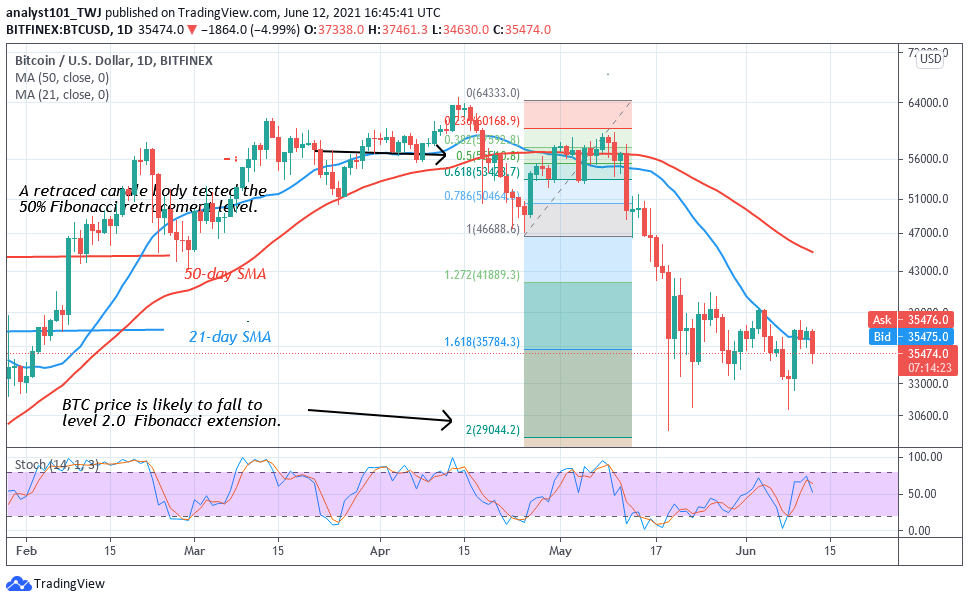
Meanwhile, BTC’s price is still fluctuating above the $35,000 support. On April 25 downtrend, a retraced candle body tested the 50% Fibonacci retracement level. The retracement indicates that Bitcoin will fall to level 2.0 Fibonacci extension. From the price action, Bitcoin has retested the Fibonacci extension and pulled back above the $35,000 support.
DOT/USD Major Trend: Bearish
Polkadot (DOT) is making an upward move after revisiting the previous low twice at $19. For the past week, DOT/USD has been in a downward correction. The crypto has earlier corrected upward to $28 high but the bullish momentum was stalled at the recent high.
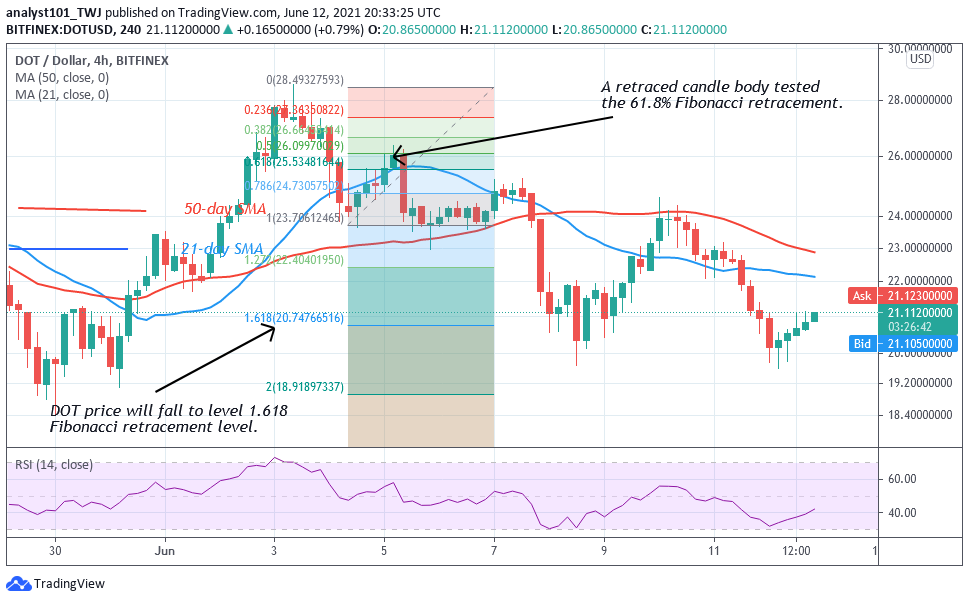
Following the rejection at $28, the DOT price was making a series of lower highs and lower lows. The altcoin fell to $20 low and resumed upward. The uptrend will resume if the $20 support holds. Meanwhile, on June 4 downtrend; a retraced candle body tested the 61.8% Fibonacci retracement level. The retracement indicates that DOT will fall to level 1.618 Fibonacci extension or level $20.74. Today, DOT/USD is making an upward move.
LTC /USD Major Trend: Bearish
Litecoin (LTC) has fallen to $163 in a downward correction. The altcoin has earlier corrected upward to $200 high on May 26. Buyers fail to sustain the bullish momentum above the $200 high because of a lack of buyers at higher price levels.
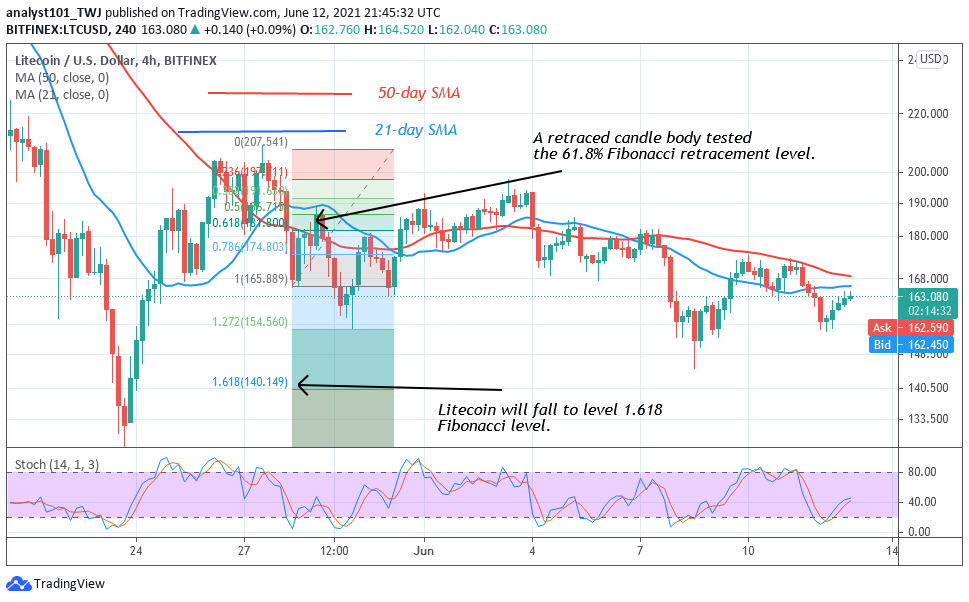
Presently, the LTC price is fluctuating between $148 and $200.Meanwhile, on May 28 downtrend; a retraced candle body tested the 61.8% Fibonacci retracement level. The retracement indicates that Litecoin is likely to fall to level 1.618 Fibonacci extension or level $140.14. From the price action, LTC’s price fell to $144 low and pulled back above $150 support. The altcoin is attempting to resume an upward move.
LINK /USD Major Trend: Bearish
Chainlink’s (LINK) price has been in a downward move as the crypto dropped to $21 low. Following the last bearish impulse on May 23, the crypto corrected upward to $35 high. However, the selling pressure compelled the altcoin to further decline on the downside.
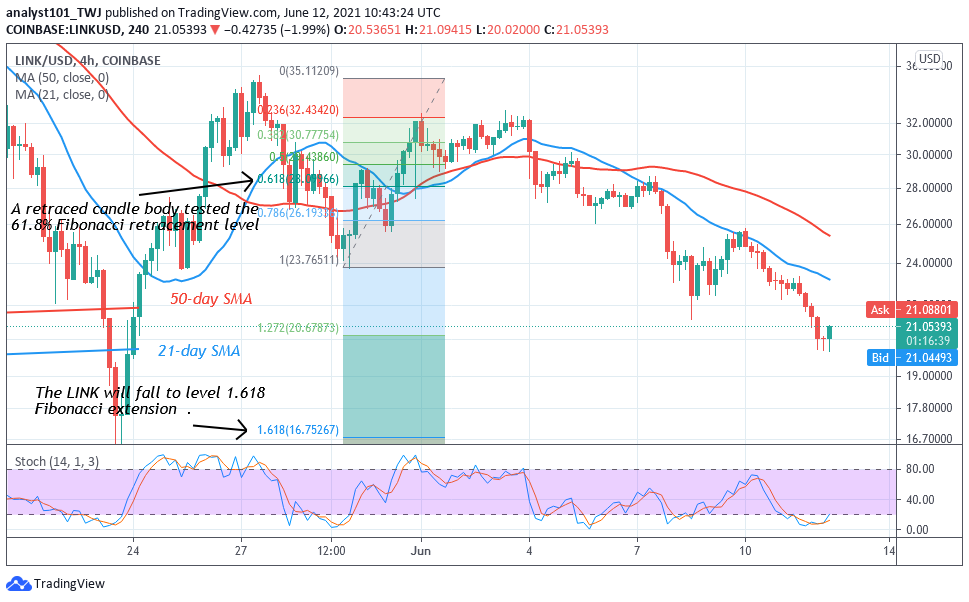
LINK price fell to $21 low. Nonetheless, if the $21 support holds, LINK/USD will resume up trending. Possibility, the coin will rise and retest the $35 high. However, Chainlink is making an upward move to the previous highs. If it faces rejection, the altcoin may fall and revisit the previous low at $18, or $15. Meanwhile, on May 29 downtrend; a retraced candle body tested the 61.8% Fibonacci retracement level. The retracement indicates that the LINK price will fall to level 1.618 Fibonacci extension or level $16.75.


