
Bitcoin’s (BTC) price is likely to continue its range-bound move for few more days as the crypto turned down from the $41,273 high. Several attempts to sustain the bullish momentum above $41,000 have failed due to a lack of buying power. The four altcoins namely Litecoin, Polkadot, Chainlink, and Ripple have declined to their previous lows.
BTC/USD Major Trend: Bearish
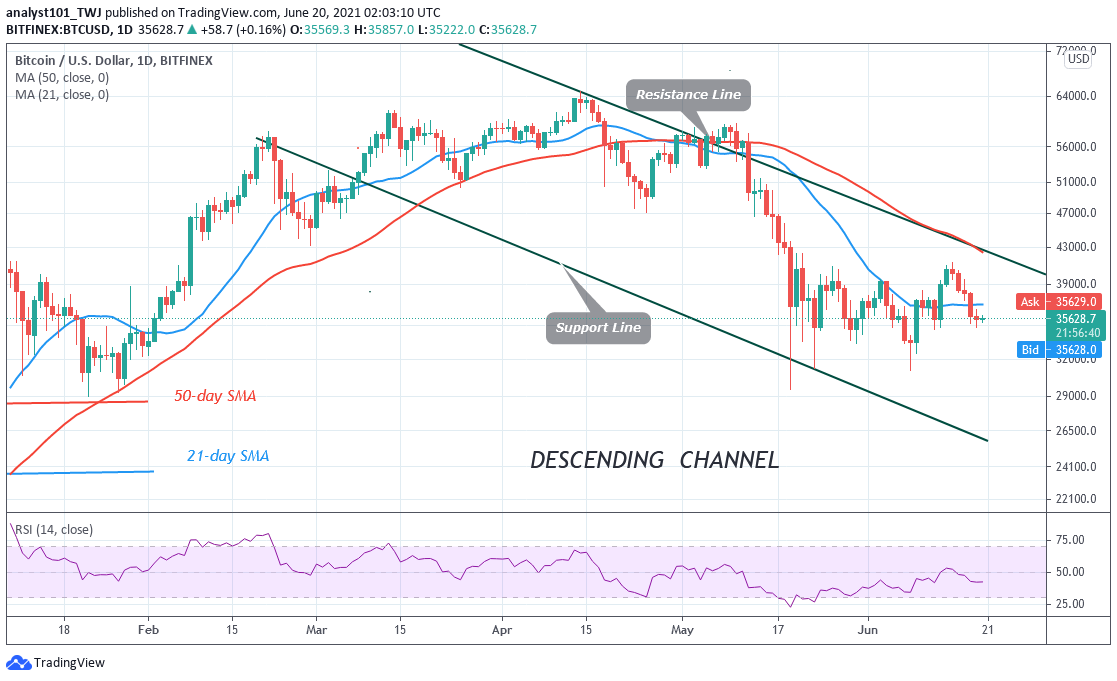
Bitcoin (BTC) turned down from the $41,000 resistance on June 15 as crypto found support above $35,000. For the past 48 hours, Bitcoin has been hovering above the $35,000 support. When this support holds buyers will attempt to push Bitcoin to retest the $41,000 resistance. The bulls are finding penetration difficult at the resistance because of a lack of buying power at higher price levels. At other times, the bears will break the $35,000 support and push the crypto to the $31,000 support. Bitcoin has been recovering at lower levels of price as bulls buy the dips. On the upside, if buyers overcome the $41,000 resistance, a rally to $46,000 is expected. Similarly, BTC price will fall to $31,000 support, if the bears break the $35,000 support.
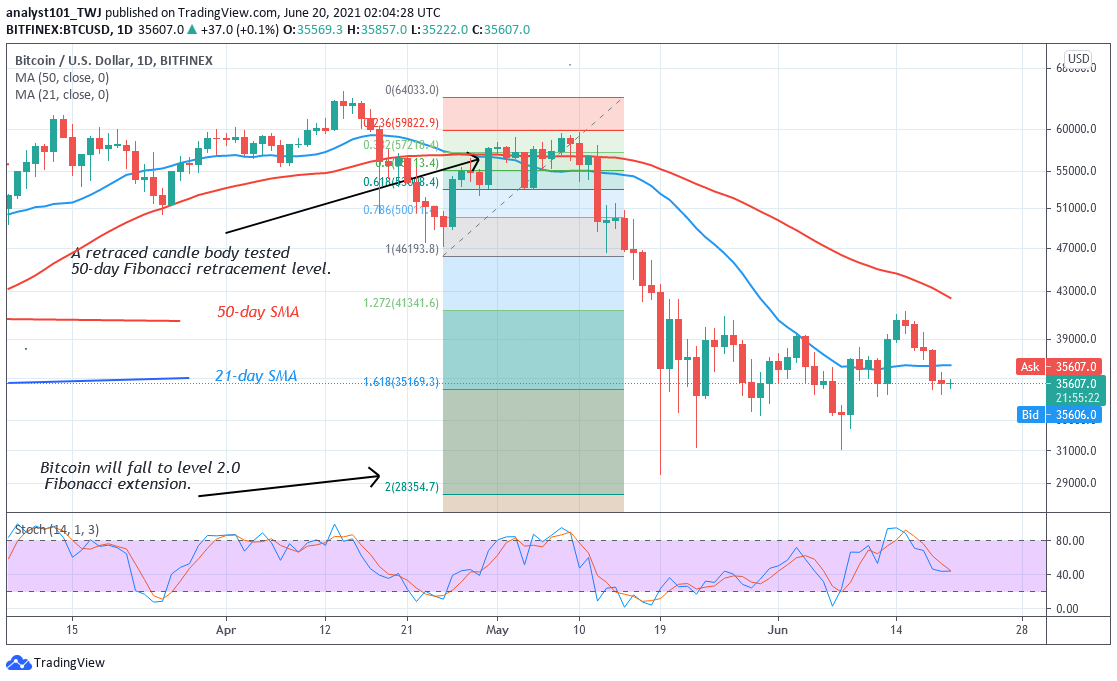
In the interim, Bitcoin fluctuates between $31,000 and $41,000 price levels. Meanwhile, on April 25 downtrend; a retraced candle body tested the 50% Fibonacci retracement level. The retracement indicates that Bitcoin will fall to level 2.0 Fibonacci extension or level $29,883.50. From the price action, Bitcoin is hovering above the $35,000 support.
DOT/USD Major Trend: Bearish
Polkadot’s (DOT) downtrend was caused by its rejection at the $26 high. From the previous high of $28, the altcoin was making a series of lower highs and lower lows. DOT price dropped to $20 low and rebounded to reach a high of $26. Buyers could not breach the $26 resistance. A break above the resistance will catapult the coin above the $28 high.
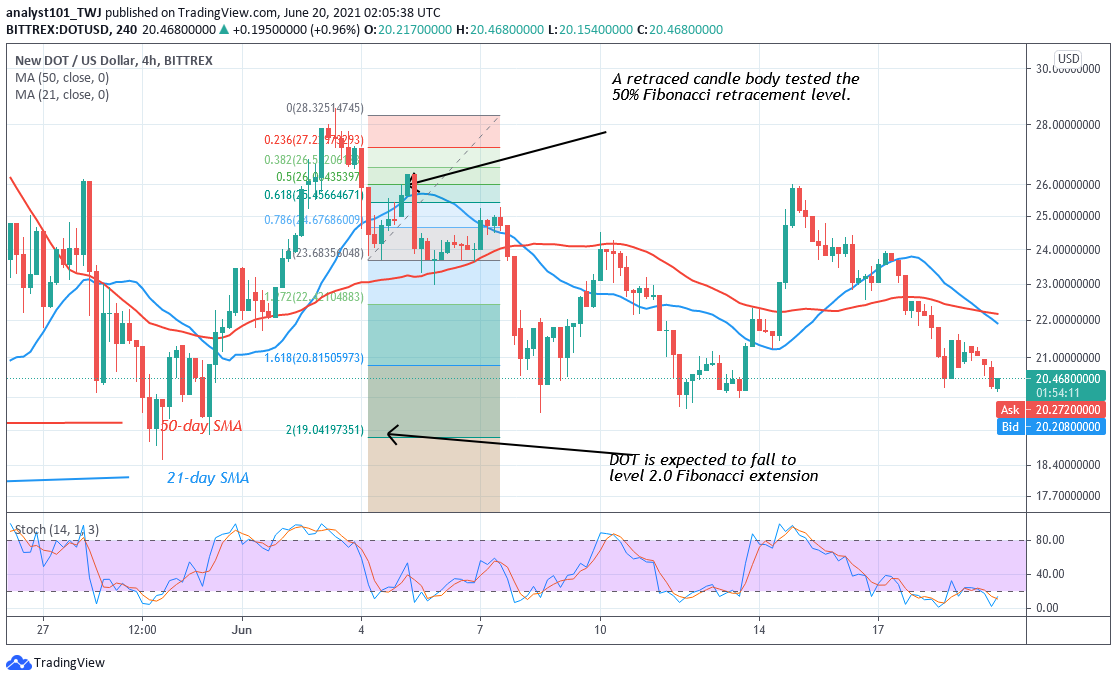
However, the bull’s failure cause the altcoin to further decline to $20 low. Meanwhile, on June 4 downtrend; a retraced candle body tested the 50% Fibonacci retracement level. The retracement indicates that DOT will fall to level 2.0 Fibonacci extension or level $19.04. From the price action, the market is reversing above the $20 support.
LTC /USD Major Trend: Bearish
Litecoin (LTC) is in a downward move as the altcoin targets the previous low of $141.42. In its last upward correction, buyers pushed LTC price upward but could not sustain above the previous lower high of $174. LTC/USD turned at the $179 high, retested the $174 before resuming the downward move. The altcoin is trading at $152.76 at the time of writing.
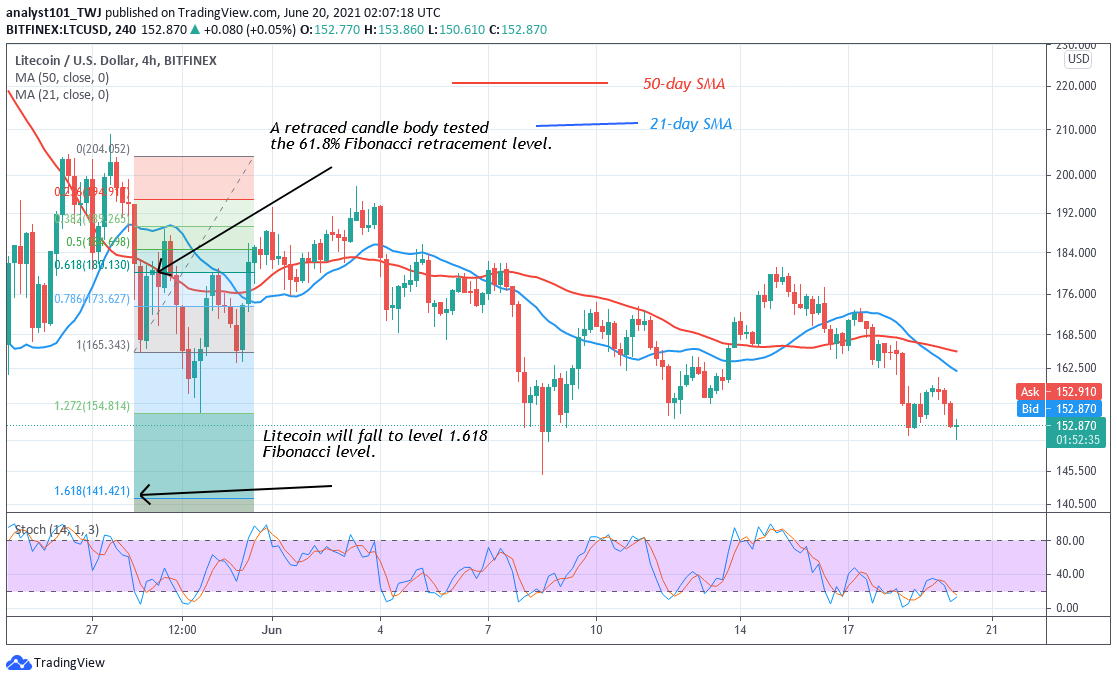
According to the Fibonacci tool, Litecoin is likely to further decline on the downside.Meanwhile, on May 28 downtrend; a retraced candle body tested the 61.8% Fibonacci retracement level. The retracement indicates that Litecoin is likely to fall to level 1.618 Fibonacci extension or level $141.42. From the price action, Litecoin is falling and approaching the 1.618 Fibonacci extensions or level 141.42.
LINK /USD Major Trend: Bearish
Chainlink (LINK) has been in a downtrend. LTC price corrected upward to $35 high but the selling pressure compelled the altcoin to resume the downtrend. In its last upward correction, buyers pushed LINK’s price upward but could not sustain above the previous lower high of $26. Consequently, the selling pressure resumed as the altcoin reached the low of $20.44.
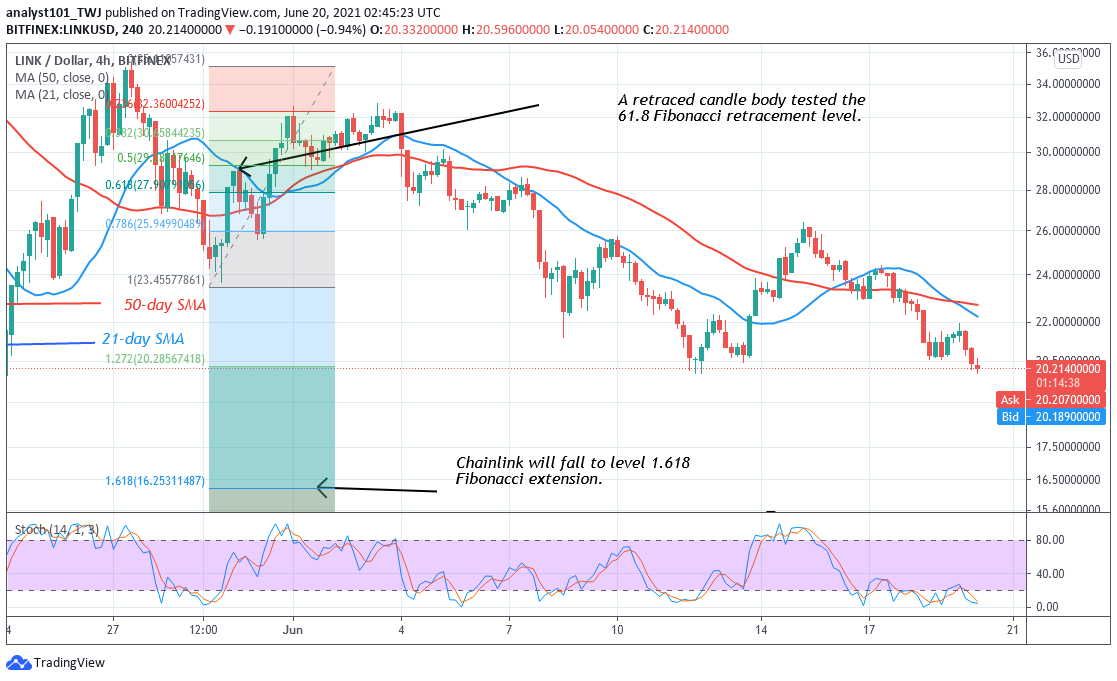
The current support at $20.44 has been holding since June 12. The uptrend will resume if the market holds at the current support. According to the Fibonacci tool, the market will further decline. Meanwhile, on May 29 downtrend; a retraced candle body tested the 61.8% Fibonacci retracement level. The retracement indicates that the LINK price will fall to level 1.618 Fibonacci extension or level $16.25.
XRP/USD Major Trend: Bearish
Ripple (XRP) has been in a downtrend after its rejection from $1.10. The altcoin fell to $0.78 low and after two days of consolidation, XRP dropped to $0.73. The RSI period 14 has indicated that XRP has fallen to level 27. In other words, the market has reached the oversold region of the market. Further downside is unlikely as the selling pressure reached bearish exhaustion.
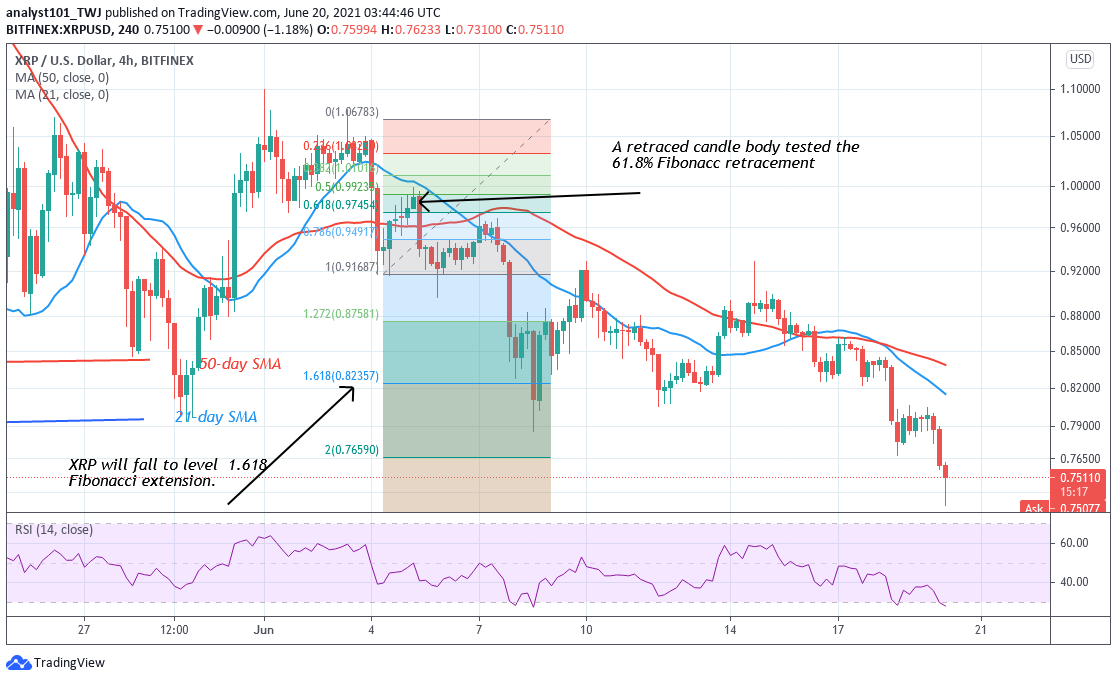
In the previous price action, the market reached a low of $0.6900 before the upward resumption. Meanwhile, on June 4 downtrend; a retraced candle body tested the 61.8% Fibonacci retracement level. The retracement indicates that XRP price will fall to level 1.618 Fibonacci extension or level $0.8228. However, XRP has fallen beyond the 1.618 Fibonacci level.


