
Bitcoin’s (BTC) price has resumed an upward move as bulls bought the dips twice this week. BTC/USD price recovered from the earlier breakdowns. Meanwhile, the altcoins are consolidating above their previous lows for a possible upward move.
BTC/USD Major Trend: Bearish
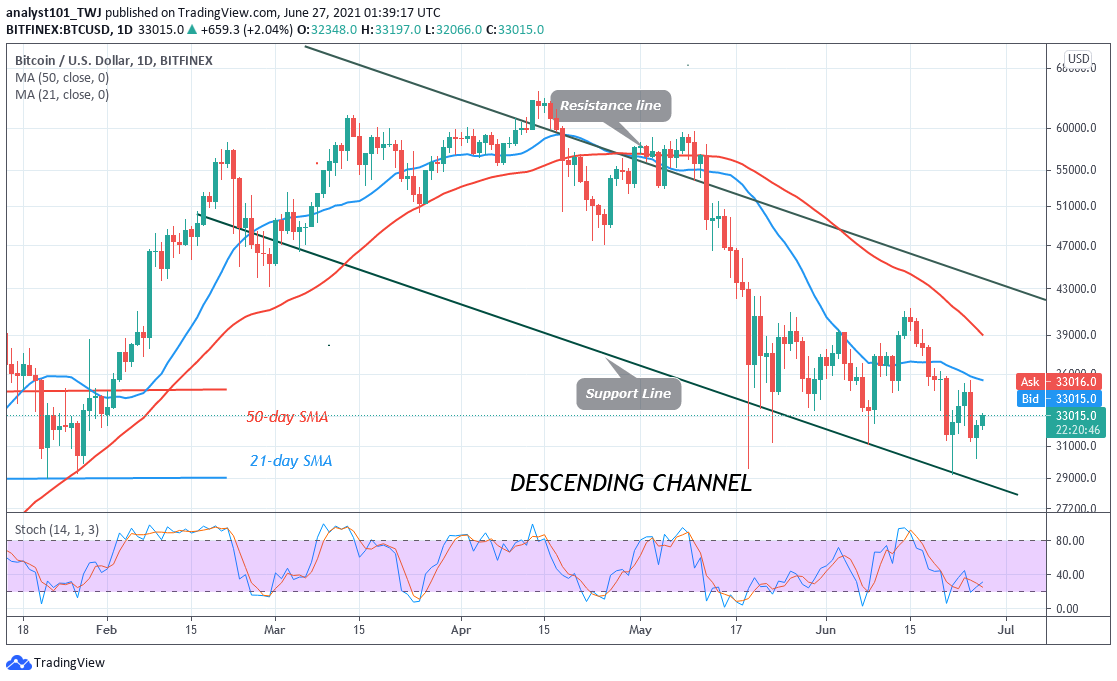
Today, Bitcoin’s (BTC) price is in a downward correction. The market fell to $29,247 low and resumed a range-bound movement between $31,000 and $41,273. For the past month, Bitcoin has been trading in a confined range. The bulls have been attempting to break the resistance above the $41,272 high. Buyers have made three unsuccessful attempts to break above the overhead resistance. If the bulls are successful, BTC’s price will rise to $42,000 high. And if the bullish momentum is sustained above the $43,000, the bull market is expected to resume.
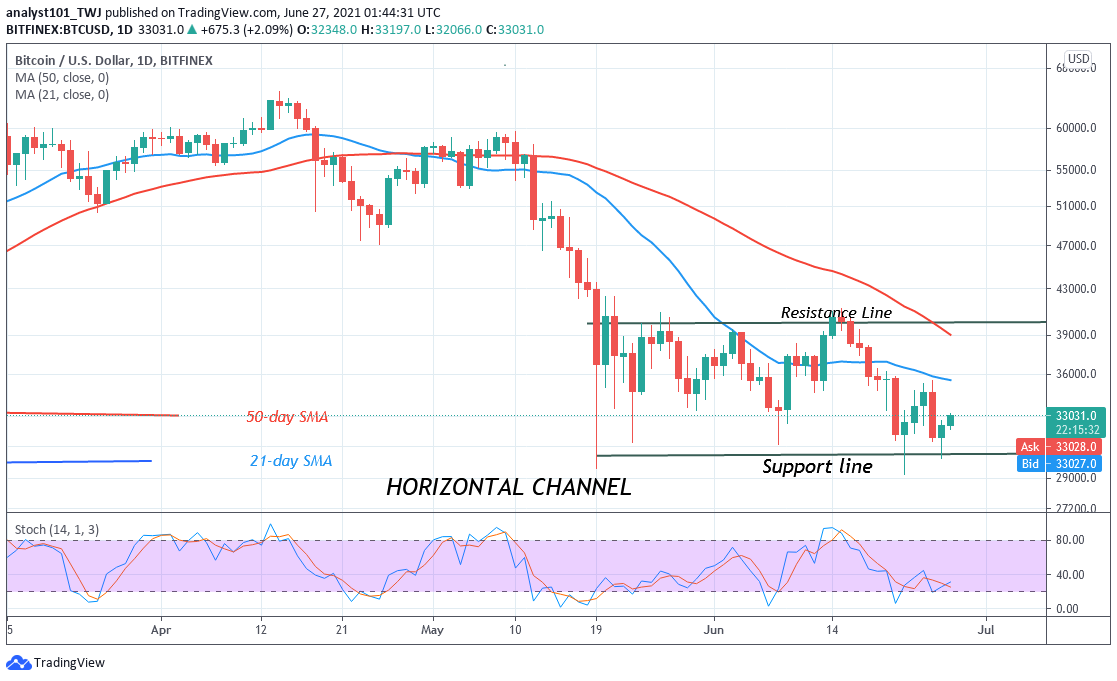
However, if buyers fail to push BTC upward, the bears will attempt to break the $31,000 support. This will compel Bitcoin to decline to $28,000 or $20,000 low. In the meantime, Bitcoin is rising and it is trading at $33,092 at the time of writing.
XRP/USD Major Trend: Bearish
Ripple’s (XRP) price is in a downward move. The current bearish trend has broken below the previous low at $0.65. Buyers are attempting to push XRP above the previous low. XRP is likely to resume selling pressure if it faces rejection at the recent high.
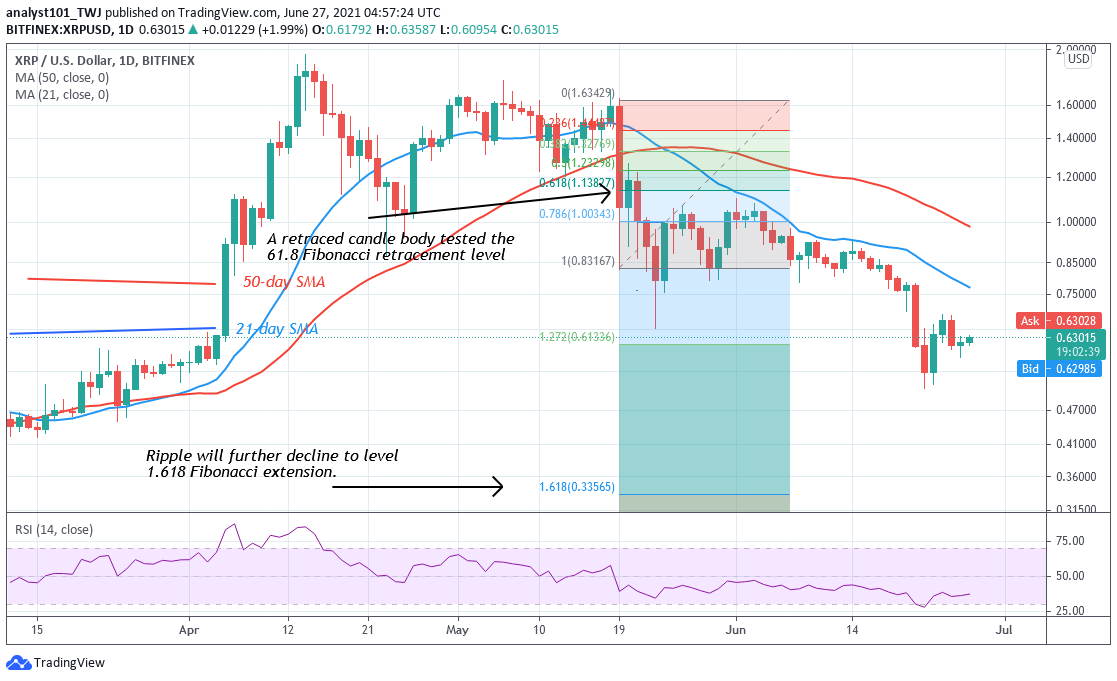
The coin is still struggling to break above $0.65 high. On the upside, if buyers push XRP above $0.65 high, the selling pressure is likely to subside. XRP/USD price will rise to retest the previous highs of $1.10 and $1.60. However, if XRP faces rejection at the $0.65 high, the crypto is likely to decline to $0.33 low. Meanwhile, on May 19 downtrend; a retraced candle body tested the 61.8% Fibonacci retracement level. The retracement indicates that XRP price will fall to level 1.618 Fibonacci extension or level $0.33.
DOT/USD Major Trend: Bearish
Polkadot (DOT) has fallen above the $13 support which has been the previous low since May 23. At this low, the market is said to be in the oversold region of the market. Further selling is unlikely as the crypto reaches bearish exhaustion. DOT is in a downward correction.
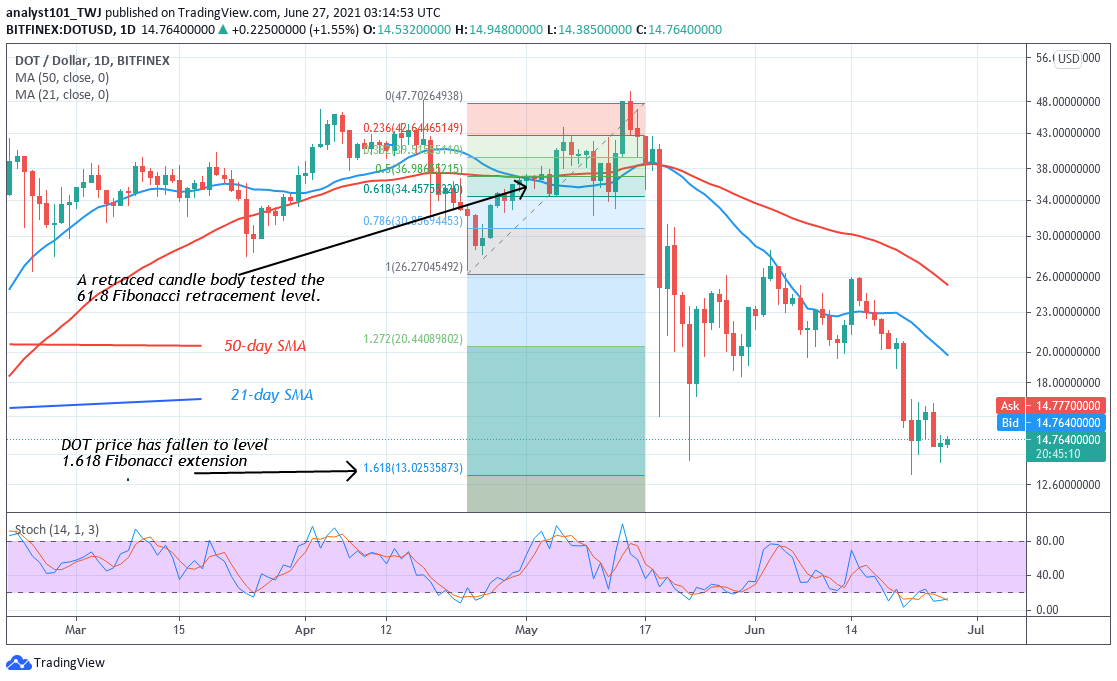
Buyers are likely to emerge to push prices upward. The market is expected to resume upward as the price action indicates bullish signals above the $13 support. At the previous low on May 23, the DOT price fell to $13 low as bulls bought the dips. The market corrected upward but the uptrend was stalled at the $26 high. Today, if the current support holds, Polkadot will resume an upward move to the previous highs. However, further selling pressure is unlikely at the oversold region of the market.
LTC /USD Major Trend: Bearish
Litecoin (LTC) has fallen above the $118 support since June 22. For the past week, the LTC price has been hovering above the current support. On the downside, if price breaks below $118, the LTC will resume selling pressure. This will cause the altcoin to decline to $70.

On May 23, the altcoin rebounded above the $118 support to resume upward. Today, if the LTC/USD rebounds, a retest at the $206 high is possible. Meanwhile, on May 19 downtrend; a retraced candle body tested the 78.6% Fibonacci retracement level. The retracement indicates that Litecoin is likely to fall to level 1.272 Fibonacci extension or level $72.09. The market is expected to reverse at level $72.09.
LINK /USD Major Trend: Bearish
Chainlink (LINK) is in a downward move. Today, LINK price has fallen and it is hovering above the previous low of May 23. On May 23, the altcoin reached the low of $15.04 as bulls bought the dips. In today’s price action, the LINK/USD price is hovering above the current support since May 23.
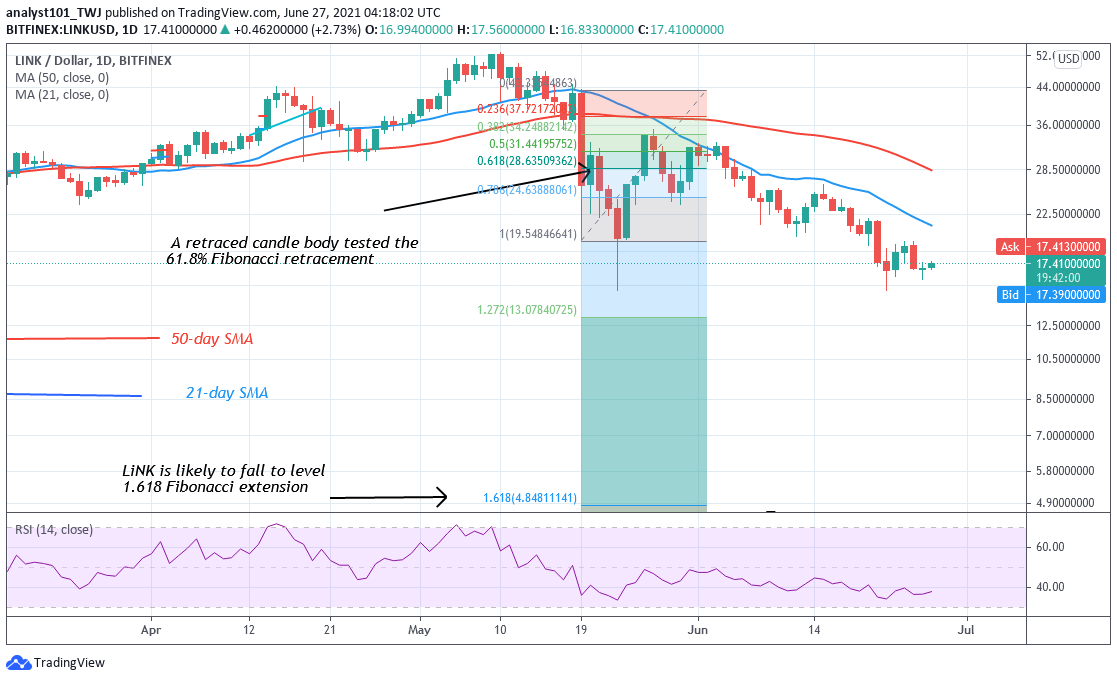
Further selling is expected if price breaks below the $15.04 support. Chainlink will drop to as low as $4.84. Meanwhile, RSI has indicated that LINK has reached level 38 and it is approaching the oversold region of the market. Nevertheless, further downsides are unlikely as buyers are likely to emerge. Meanwhile, on May 19 downtrend; a retraced candle body tested the 61.8% Fibonacci retracement level. The retracement indicates that the LINK price will fall to level 1.618 Fibonacci extension or level $4.84.


