
Bitcoin price is in a range-bound move between $30,000 and $40,000 price levels. The king coin has been hovering above the $35,000 support for the past two weeks. A rebound above the current support will catapult the coin out of downward correction. The three altcoins namely Polkadot, Litecoin, and Chainlink have recovered from their respective downtrend. These altcoins are confined in ranges as bulls struggle to resume upside momentum.
BTC/USD Major Trend: Bearish
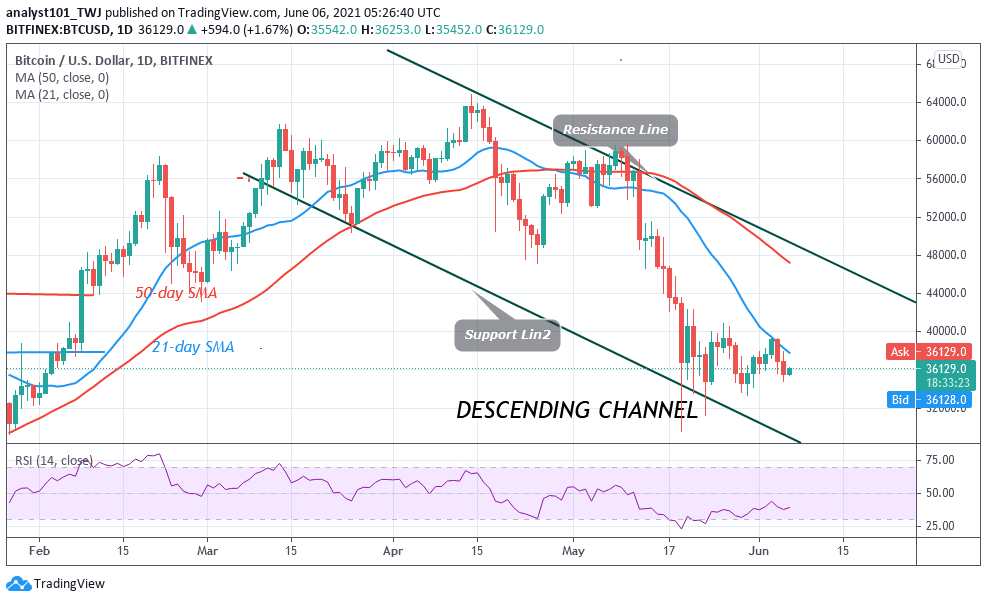
Since May 19, BTC/USD has been in a downward correction. For the past three weeks, BTC’s price has been fluctuating between $30,000 and $40,000. Bitcoin price fluctuation has been narrowed down between $34,000 and $40,000. For the past weeks, the bulls and bears have been making frantic efforts to break the range-bound levels. For instance, BTC’s price faced rejection from the high of $39,000 and slumped to $36,500 low. Buyers were able to curtail the bearish movement as price hovers above the $35,000 support. On the downside, if the bears have broken the $34,000 support, Bitcoin would have fallen to the low of $30,000. Subsequently, the bears may want to push the crypto downward.
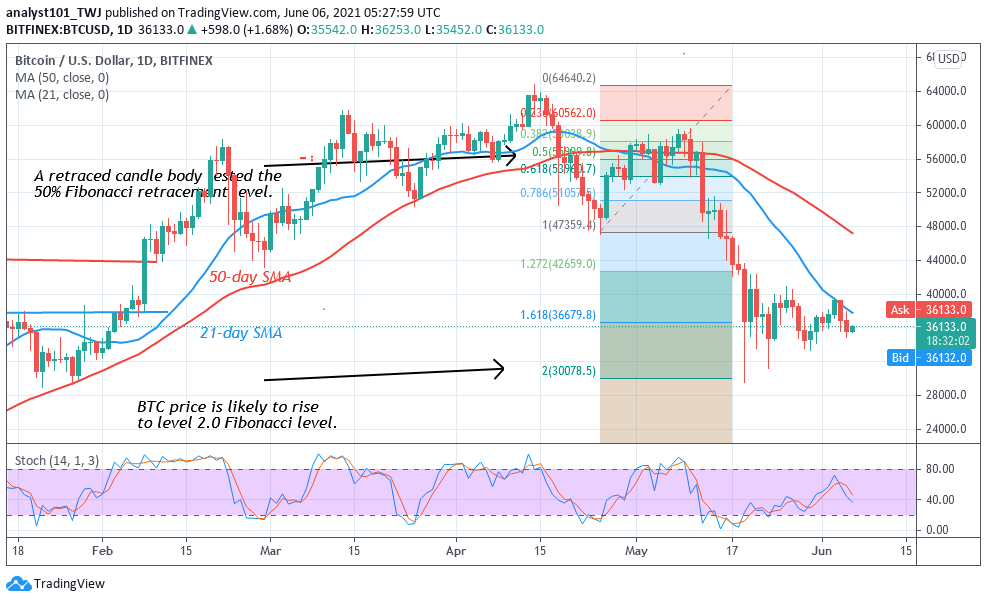
However, if the $30,000 support cracks, Bitcoin will decline to $28,000 of $20,000. At this price level, there will be panic buying the dips or panic selling. Meanwhile, the Fibonacci analysis has remained the same. On April 25 downtrend; a retraced candle body tested the 50% Fibonacci retracement level. The retracement indicates that Bitcoin will fall to level 2.0 Fibonacci extension or level $30,078.50.50. From the price action, the long candlestick tail indicates that the bulls have bought the dips as price corrected upward. BTC price tested the Fibonacci level but pulled back. Bitcoin is trading at $36,133 at the time of writing
DOT/USD Major Trend: Bearish
Polkadot (DOT) has recovered from the recent downtrend above the $16 low. The bulls bought the dips as the crypto rose to the high of $28. Buyers could not sustain the bullish momentum above the $28 resistance as the crypto was resisted. The crypto’s price retraced to $24 support and resumed upward. The altcoin has been in an upward correction after it plunged to a $16 low.
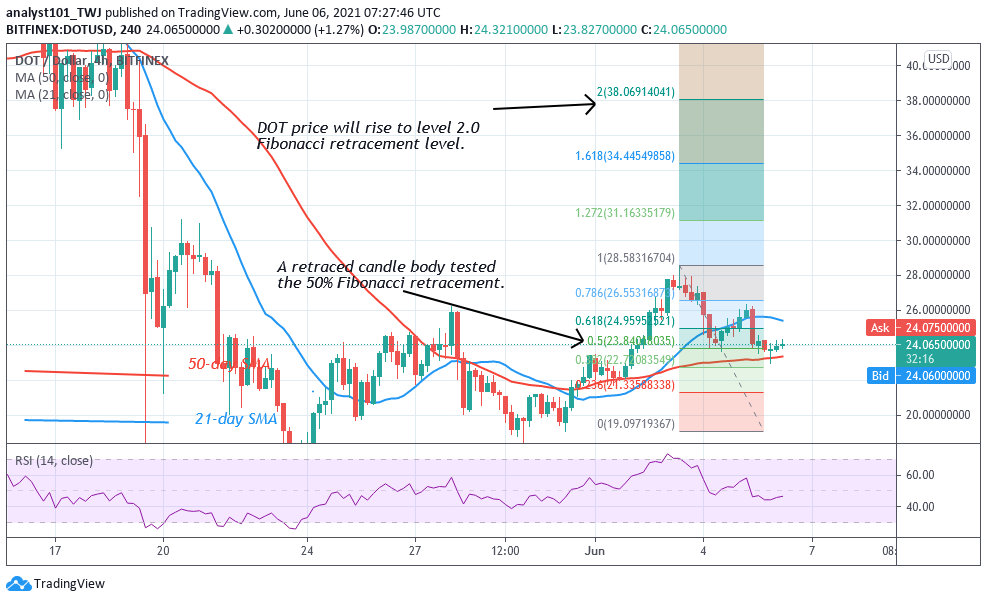
The $28 high was the second uptrend that faced rejection from the recent high. The current uptrend depends on breaking the resistance at $28. A breakout will push the prices upward. On the other hand, if the bulls fail to break the $28 resistance, the crypto will continue its range-bound movement. Meanwhile, on June 3 uptrend; a retraced candle body tested the 50% Fibonacci retracement level. The retracement indicates that DOT will rise to level 2.0 Fibonacci extension or level $38.06. Today, DOT/USD is trading at $24.27 at the time of writing.
LTC /USD Major Trend: Bearish
Litecoin (LTC) is fluctuating below the $200 resistance since May 26. The altcoin has earlier recovered after falling to the low above $120. The bulls bought the dips as price rallied to $200 high on May 26. The upward move was terminated as the altcoin resumes a downward correction.
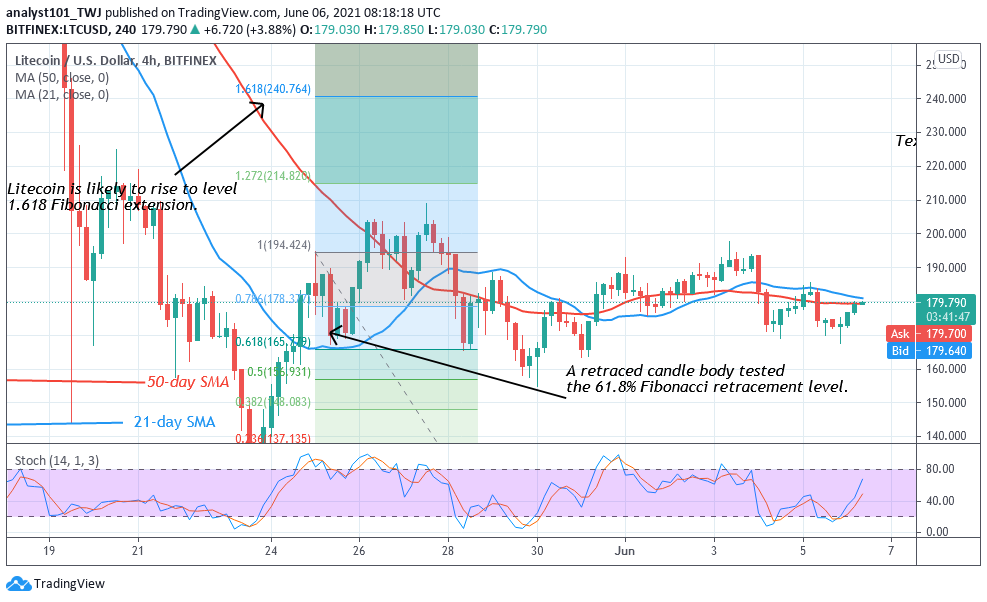
Presently, LTC/USD is range-bound between $160 and $200. Buyers and sellers are in price tussle within the price range. Litecoin will further decline to the previous low at $118 if the bears break the $160 support. Similarly, the crypto will rise to $240, if buyers break the current resistance at $200. Meanwhile, on May 25 uptrend; a retraced candle body tested the 61.8% Fibonacci retracement level. The retracement indicates that Litecoin is likely to rise to level 1.618 Fibonacci extension or level $240.76.
LINK /USD Major Trend: Bearish
Chainlink is in a downward correction. The upward move is facing rejection at the high of $32. In the previous price action, the altcoin recovered above the $16 support as price rallied to $35 high. Presently, the upward move has been restricted below $32 high.
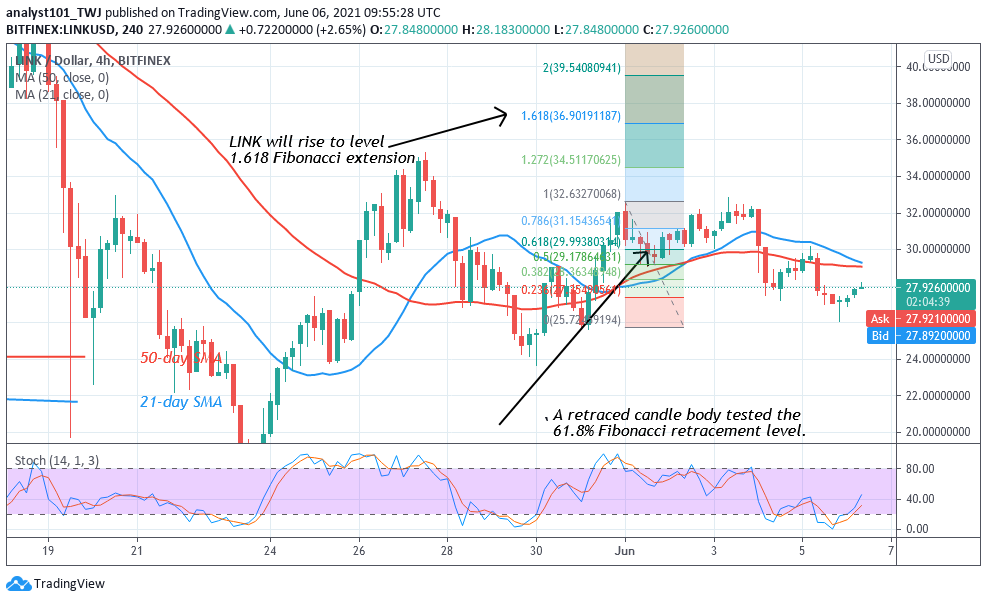
LINK price now fluctuates between levels $24 and $32. Chainlink will rise to $36 if the current resistance is breached. On June 4, the crypto was repelled at the $39 resistance as the market dropped to $26 low. Meanwhile, on June 1 uptrend; a retraced candle body tested the 61.8% Fibonacci retracement level. The retracement indicates that the LINK price will rise to level 1.618 Fibonacci extension or level $36.90.


