
Bitcoin bulls have broken the $60,000 psychological price. BTC price rallied to $61,243 high. Can the bulls sustain the bullish momentum above the $60,000 support? If yes, Bitcoin is likely to resume upside momentum as price will rally above $70,000 high. If no, the king coin will fall and becomes range-bound between $57,000 and $60,000 price levels. The altcoins have one resistance to breach in order to resume up trending.
BTC/USD Major Trend: Bullish
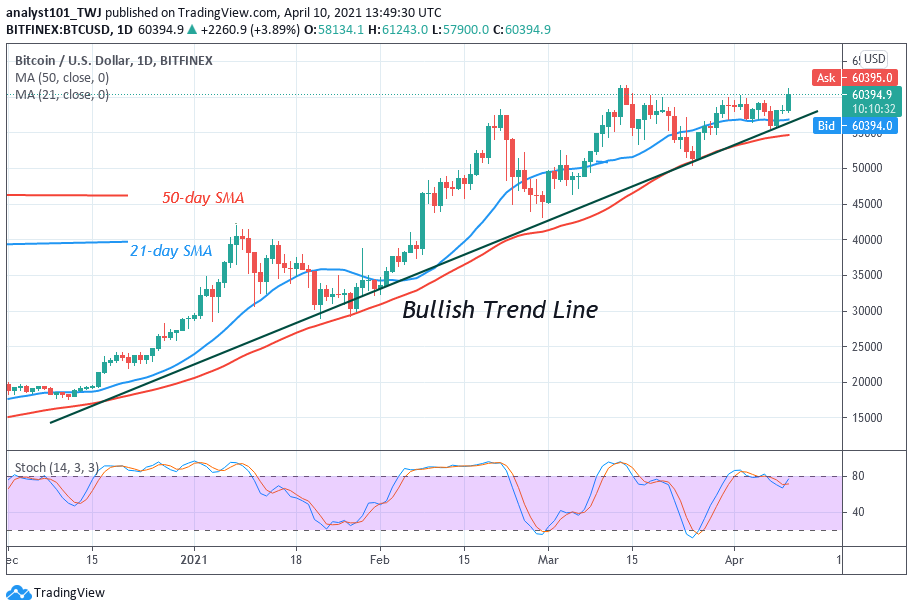
BTC price has broken the $60,000 overhead resistance as price reached the high of $61,243. The king coin made a pullback above the psychological price level. Today, BTC price is falling after reaching the recent high. If price falls and breaks below the $60,000 support, the price action of the previous week will be repeated. On April 2, buyers breached the overhead resistance as price reached a high of $60,190. The bulls could not sustain the bullish momentum as price retraced and broke below the $60,000 support. Bitcoin dropped to $57,000 low and resumed a range bound movement between $57,000 and $60.000 price levels. In the previous week, buyers and sellers were able to hold price movement in a confined range.
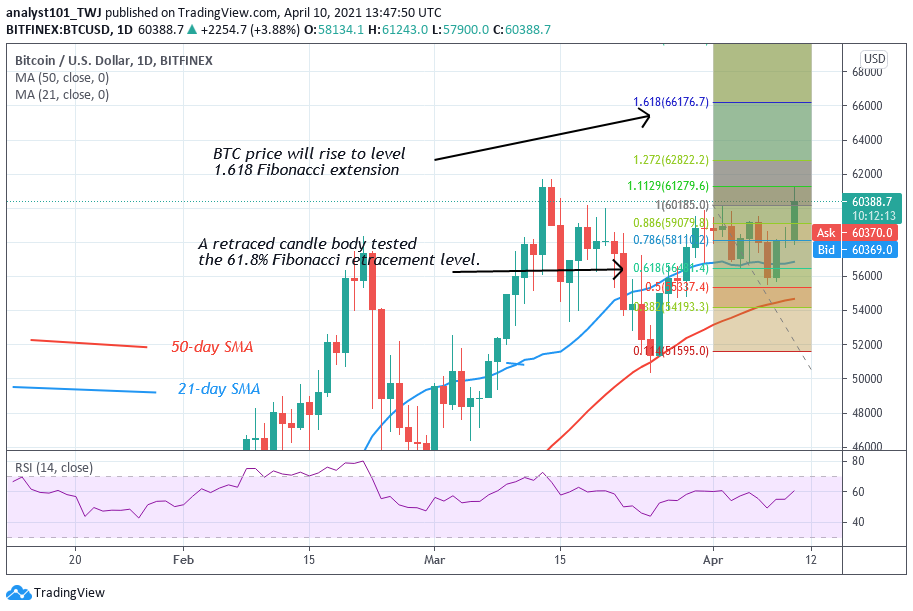
Today, Bitcoin bull has broken the overhead resistance again. If buyers sustain the bullish momentum above the overhead resistance, the upside momentum will resume. Bitcoin will rally above the next psychological price level. Meanwhile, on April 1 uptrend; a retraced candle body retested the 61.8% Fibonacci retracement. This retracement implies that the BTC price will rise to level 1.618 Fibonacci extension or the high of $66,176.70. From the price action, the BTC price is fluctuating between $60,000 and $61,200 at the time of writing.
DOT/USD Major Trend: Bullish
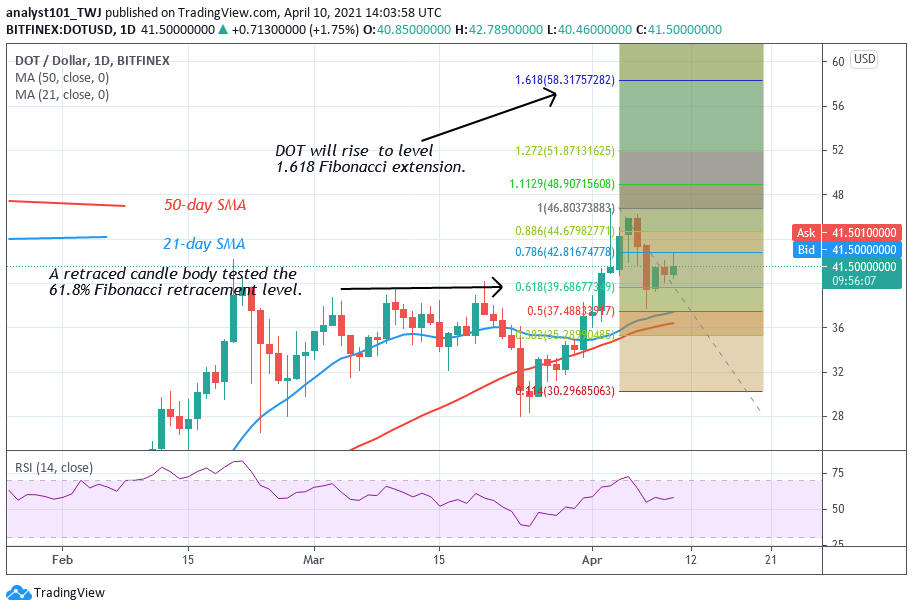
Presently, Polkadot is fluctuating below the $42 resistance. On April 5, DOT price rallied to $46 high and it was resisted. The altcoin fell to $38 low and commenced a range bound move below the resistance at $42. On the upside, if buyers break the resistances at $42 and $46, upside momentum will resume. Nevertheless, if the bulls are successful, DOT/USD will rally above $60 high. Meanwhile, the Fibonacci tool has indicated a possible movement of price. On April 5 uptrend, the retraced red candle body tested the 61.8% Fibonacci retracement. This retracement indicates that the market will rise to level 1.618 Fibonacci extension or the high of $58.
LTC /USD Major Trend: Bullish
In the previous week, Litecoin rallied and retested the resistance at $240. The bulls could not sustain the bullish momentum above the overhead resistance. Consequently, LTC price fell to $210 support as price corrected upward. Today, the LTC price is retesting the resistance at $230.
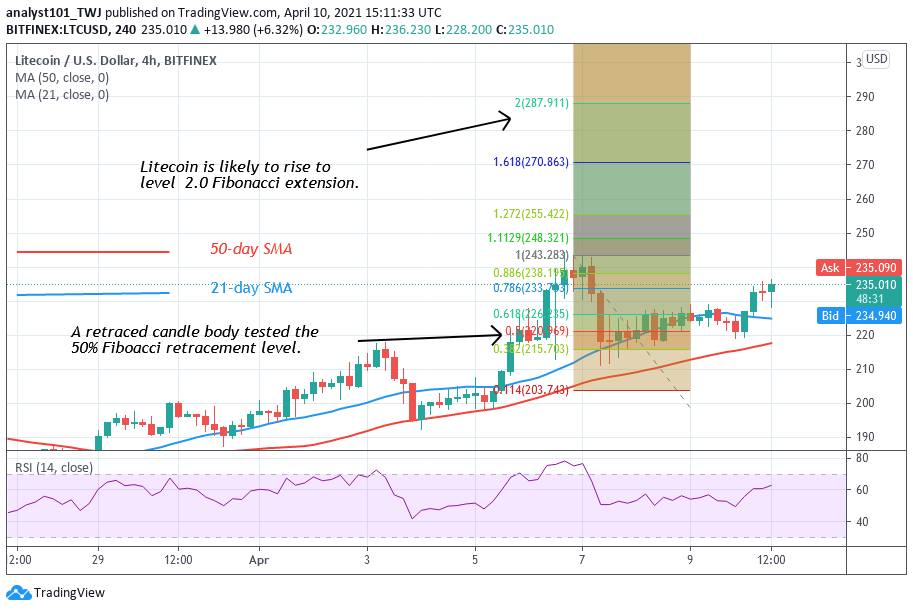
LTC/USD will be out of the bear market if buyers can clear the resistances at $230 and $240. The altcoin will rise to $270 if the bulls are successful. Presently, buyers are attempting to break the resistance at $230. Nevertheless, there is every indication that Litecoin will rise on the upside. On April 6 uptrend; a retraced red candle body tested the 50% Fibonacci retracement level. The retracement implies that the crypto will rise to level 2.0 Fibonacci extension or the high of $287.97.
LINK /USD Major Trend: Ranging
For the past week, buyers retested the $35 overhead resistance and were resisted. The altcoin fell to a $30 low and resumed a downward correction. The $35 overhead resistance has not been broken since February 13. Chainlink has been in a downward correction for the past two months. On the upside, if buyers breach the $35 overhead resistance, LINK will rally above $40.
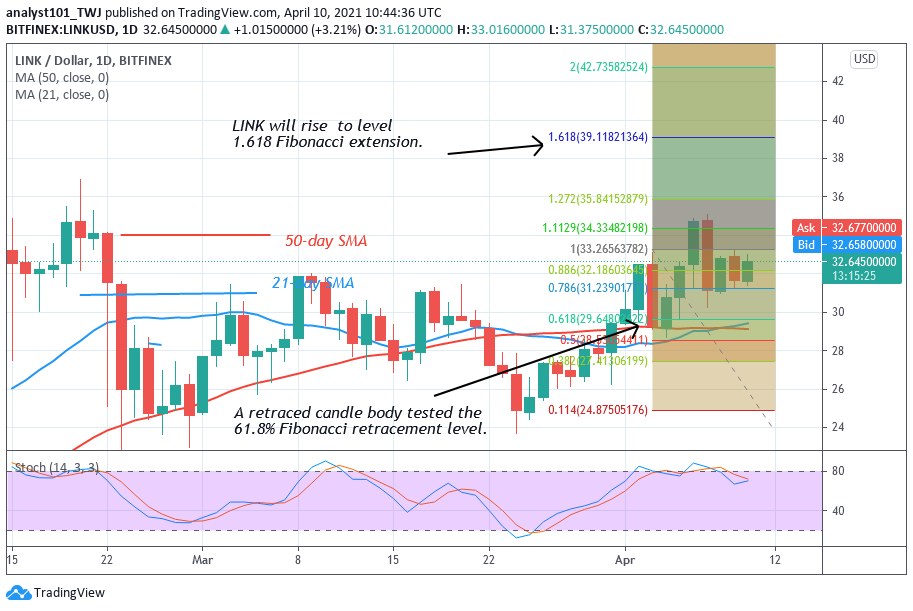
Conversely, if buyers fail to break the overhead resistance the downward correction will linger on. Alternatively, the bears will sink the altcoin to the previous low at $24. Meanwhile, the price indicator has indicated an upward movement of price. On April 2 uptrend; a retraced candle body tested the 61.8% Fibonacci retracement level. This retracement gives the impression that LINK will rise to level 1.618 Fibonacci extension. That is the high of $39.11. This week if the bulls break the overhead resistance, Chainlink will resume upside momentum.


