
Bitcoin (BTC) and the other cryptocurrencies are in a downward correction. The cryptos are trading in a confined range. BTC price and the altcoins are holding above the April 11 price levels as the selling pressure subsides. Further upward moves are being repelled by the bears. This has compelled the cryptos to resume a range-bound move for a few more days.
BTC/USD Major Trend: Bearish
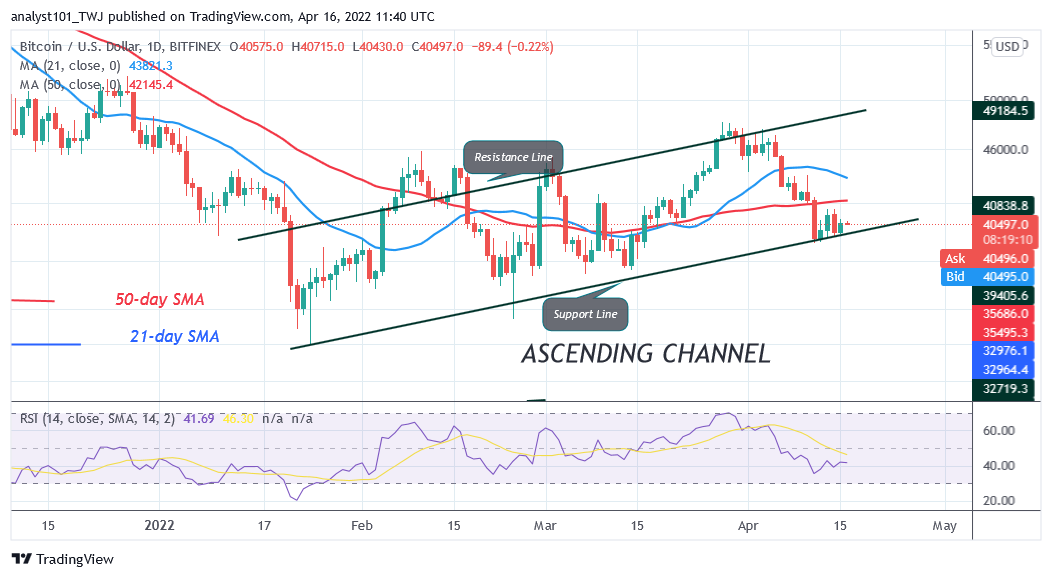
Bitcoin’s (BTC) price is in a downward correction as price breaks below the moving averages. Presently, the downtrend has subsided as BTC price declined to the low of $39,223 low. Since April 11, Bitcoin has resumed a sideways move as it fluctuates in a tight range. BTC price fluctuates between $39,200 and $41,500 price levels. For the past week, the price movement has remained stagnant because of the presence of small indecisive candlesticks called Doji and Spinning tops.
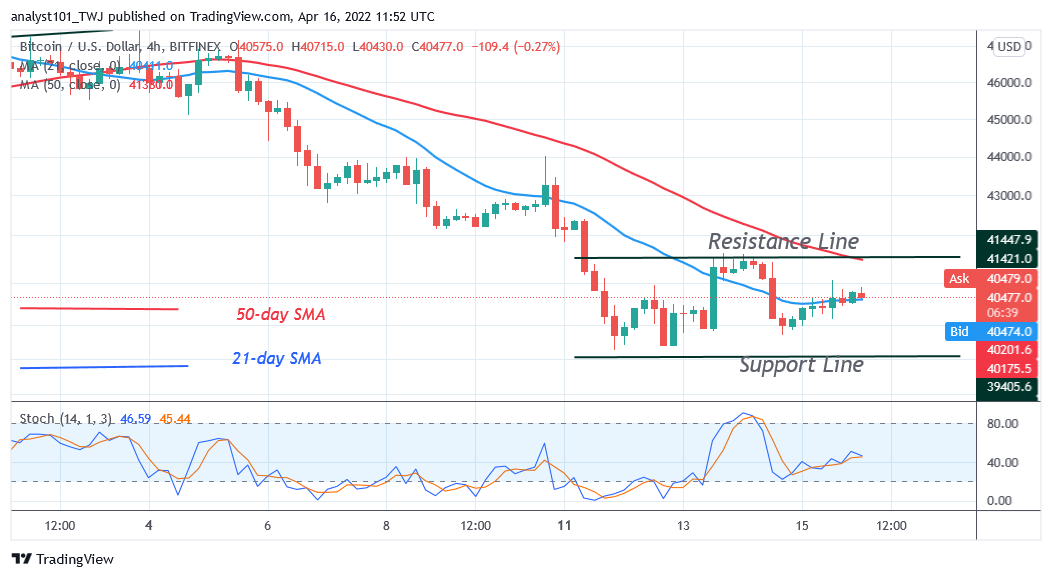
These candlesticks indicate that buyers and sellers are undecided about the direction of the market. Today, Bitcoin is trading in the middle of price range as it trades marginally. The next price movement will be marked by a price rebound. BTC’s price is trading at $40,400 as of press time. On the upside, if the price rebounds, it will break the resistance at $42,607 and rally above the moving averages. On the downside, if the bears break below the $39,223 support, Bitcoin will decline to $37,000 low.
XRP/USD Major Trend: Bearish
Ripple’s (XRP) price is still in a downward correction. On April 15, buyers attempted to push XRP above the $0.80 high but were repelled.
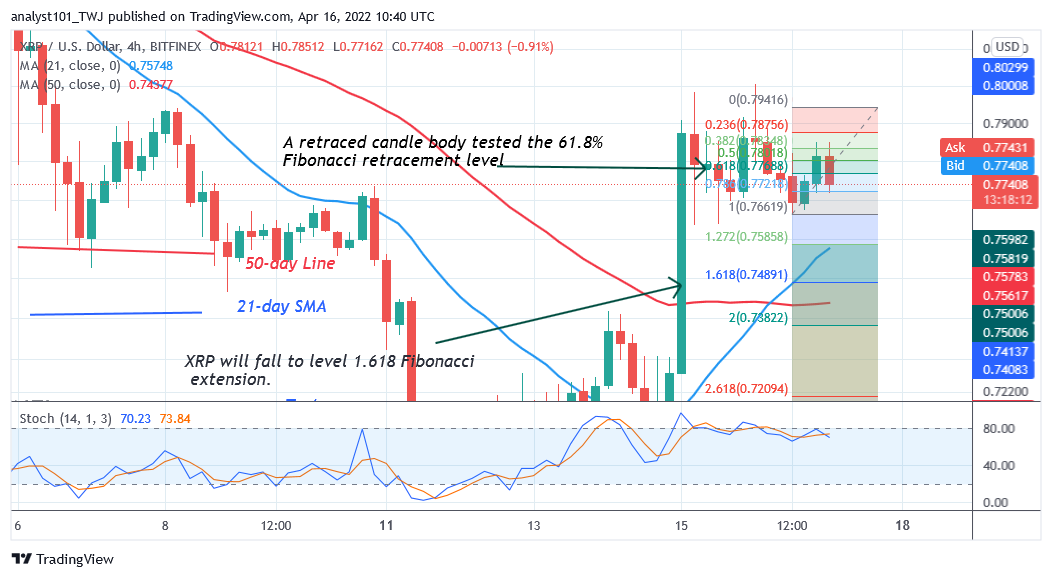
For the past three days, the bulls could not sustain the bullish momentum above the recent high. The cryptocurrency is likely to face rejection at the recent high. Meanwhile, on April 16 downtrend; a retraced candle body tested the 61.8% Fibonacci retracement level. The retracement indicates that XRP will fall to level 1.618 Fibonacci extension or $0.74. The upward move will resume if price retraces to the $0.74 low or above the moving averages.
DOT/USD Major Trend: Bearish
Polkadot’s (DOT) price is in a downward correction as the bears pushed the cryptocurrency to the low of $17. The selling pressure has subsided as bulls bought the dips.DOT price is correcting upward as the market reaches the high of $18.69.
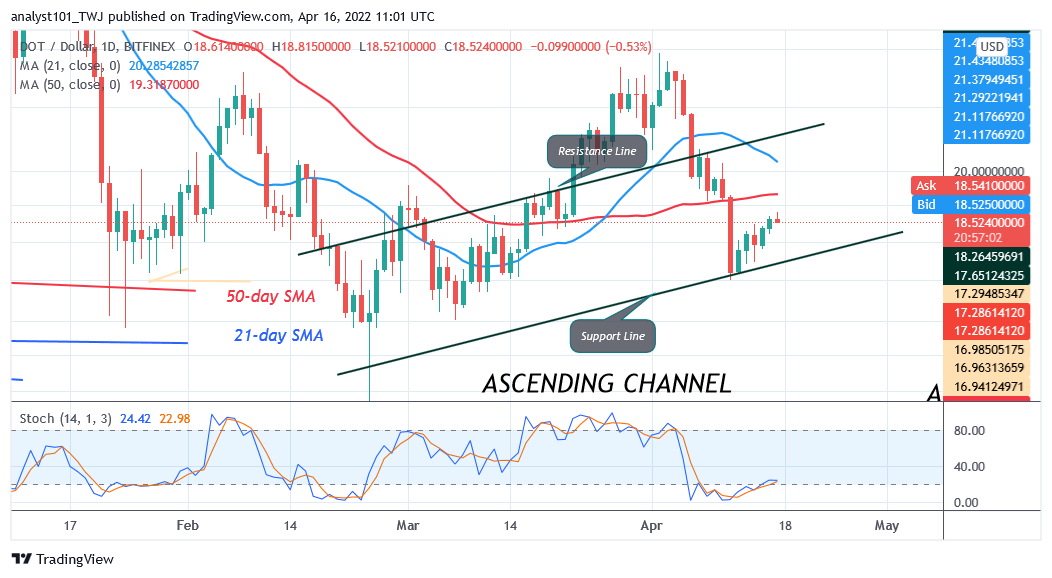
The altcoin is facing rejection at the $19 resistance zone. The uptrend will resume if the resistance at $19 and $20 is cleared. On the upside, a break above the resistance levels will propel the altcoin to reach the high of $23. However, if the bulls fail to break the recent high, DOT/USD will be compelled to a range-bound move. Probably, the market will be fluctuating between $17 and $23 price levels.
LTC /USD Major Trend: Bearish
Litecoin’s (LTC) price is likely to resume selling pressure as the cryptocurrency reached the high of $114. On April 11 downtrend, the market declined to the low of $102 as bulls bought the dips. Litecoin price corrected upward as the bulls broke above the 50-day line SMA.
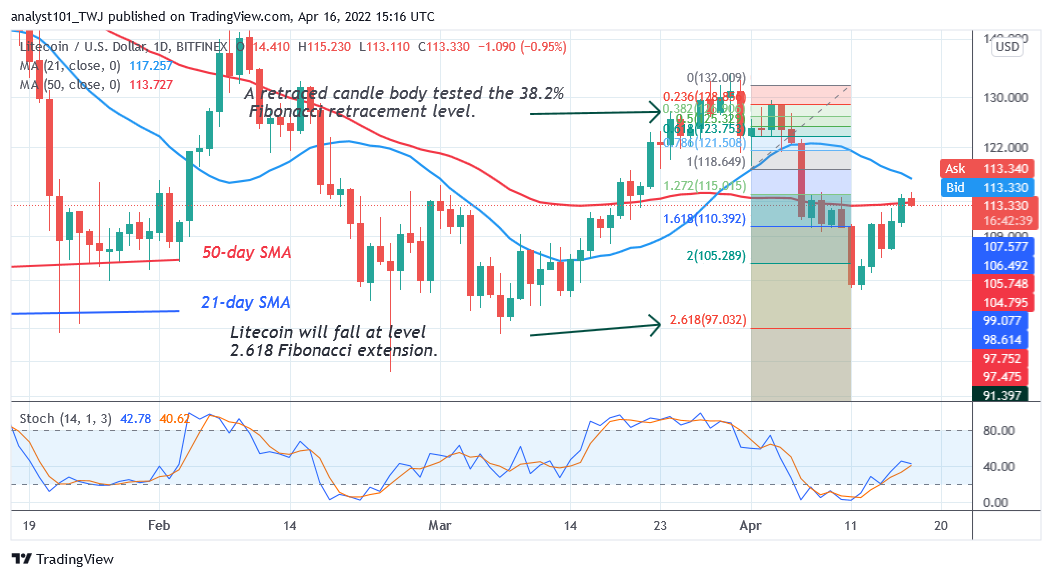
The current bullish move is facing resistance at the recent high. On the upside, if the bulls are successful, LTC will rise to break above the 21-day line SMA. This will propel the Litecoin price to revisit the previous high of $130. Conversely, if the altcoin faces rejection at the recent high, the market will fall to the previous low at $102. Meanwhile, on April 1 downtrend; a retraced candle body tested the 38.2% Fibonacci retracement level. The retracement suggests that the LTC price will fall to level 2.618 Fibonacci extension or $97.03. The cryptocurrency will decline to 2.618 Fibonacci extension or $97.03 if it loses the $102 support.
LINK /USD Major Trend: Bearish
Chainlink’s (LINK) price is in a downward correction as the cryptocurrency declined to the low of $13.53. The downtrend has subsided as the altcoin resumed a sideways move above the current support.
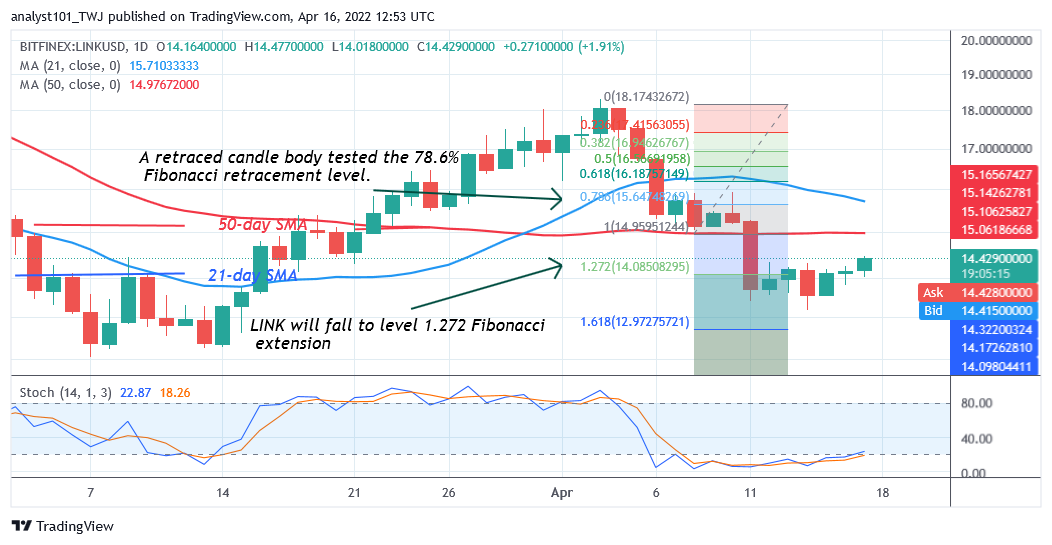
For the past week, the LINK price has been consolidating above the $13 support. Today, cryptocurrency is rising to the previous highs. The uptrend is likely to face resistance at the $14 and $15 price levels. On the upside, a break above the resistance levels will catapult the altcoin to retest the $17 high. Conversely, if the Chainlink turns from the recent high, the cryptocurrency will resume a range-bound move between $13 and $17 price levels.


