
BTC/USD has been in a downward move after the bulls failed to breach the $65,000 resistance level. The king coin is likely to regain bullish momentum above the $60,000 psychological price level to resume upside momentum. The three altcoins namely, Polkadot, Litecoin, and Chainlink are making positive moves on the upside. However, the altcoins have to break the recent highs to resume up trending.
BTC/USD Major Trend: Bullish
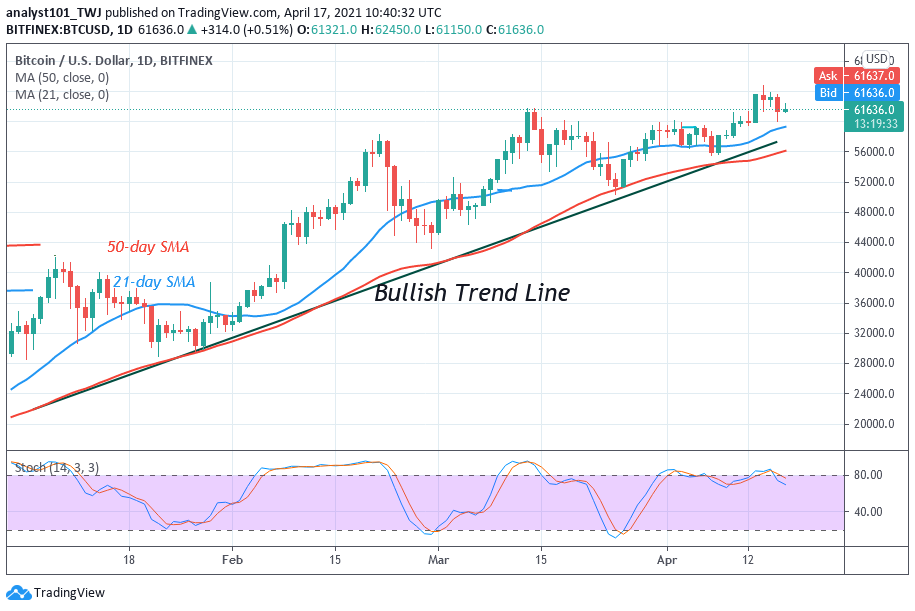
On April 14, BTC price rallied to $64,829 after clearing the $60,000 and $61,825 resistance zones. Bitcoin bulls have failed to breach the $65,000 resistance zone. If the bulls were successful, BTC price would have rallied above the $70,000 high. However, For the past four days, the market has fallen back to the $60,000 psychological price level. Bitcoin price is making a series of lower highs and lower lows. On April 14, Bitcoin made a lower low of $61,306. The following day, it made a lower high of $63,694.

Yesterday, it made another lower low of $60,005. Today, the BTC price has corrected upward to $62,450 which was later resisted. Bitcoin is now in a downward move. BTC/USD is hovering above $60,000 support. The uptrend will resume if the support holds. Otherwise, the selling pressure will resume. Meanwhile, on April 14 downtrend a retraced candle body retested the 61.8% Fibonacci retracement. This retracement indicates that the BTC price will fall to level 1.618 Fibonacci extension or the low of $59,115.90. Today, the BTC price is trading at $60,825 at the time of writing. Further downside is possible if the $60,000 support is breached.
DOT/USD Major Trend: Bullish
Today, buyers pushed the DOT price to the high of $48 and pulled back. For the past two weeks, buyers have been struggling to break the $46 overhead resistance. Consequently, Polkadot has been fluctuating between $40 and $44 in a tight range. DOT/USD will trend upward if buyers break the minor resistance at $44 and retest the $46 overhead resistance.

The market will rise to $58 high if buyers are successful above the overhead resistance. Conversely, if sellers break below the $40 support, the altcoin will decline to either $32 or $28 low. Meanwhile, on April 3 uptrend; the retraced red candle body tested the 61.8% Fibonacci retracement. This retracement indicates that the market will rise to level 1.618 Fibonacci extension or the high of $58.32
LTC /USD Major Trend: Bullish
Litecoin rallied to the high of $334 on April 17 but face rejection at the $340 resistance zone. Today, the resistance zone has been retested thrice at the time of writing. On the upside, if buyers break the $340 resistance, the altcoin will rise to $360 high.
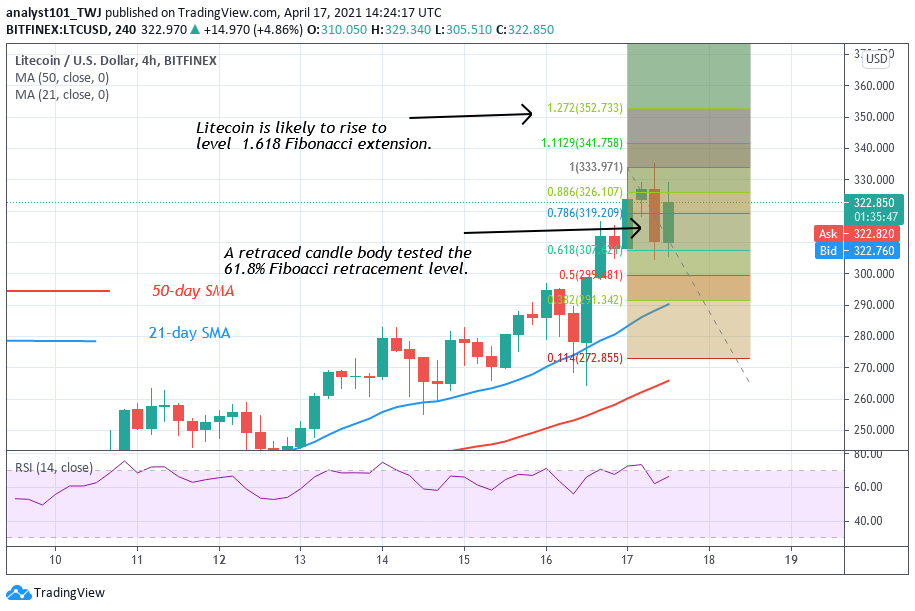
The $360 high is the historical price level of 2017. The current uptrend is likely to face resistance at the historical price level. Meanwhile, the LTC price is fluctuating below the $340 resistance zone. The Fibonacci tool has indicated a possible upward move and subsequent reversal of the trend. On April 17 uptrend; a retraced candle body tested the 78.6% Fibonacci retracement level. The retracement implies that the crypto will rise to level 1.272 Fibonacci extension or the high of $352.73 and reverse. It will reverse to 78.6 % Fibonacci retracement where it originated.
LINK /USD Major Trend: Bullish
Chainlink price is falling after rejection at the $44 resistance. The rejection was twice, thereby forming a bearish double top pattern. This pattern indicates that the altcoin will resume a downward move. The downtrend may extend to the low of $35 support which was the previous resistance level. In the previous price action, buyers breached the $35 overhead resistance, to regain upside momentum. On the downside, if price retraces and finds support above $38, the uptrend will resume.
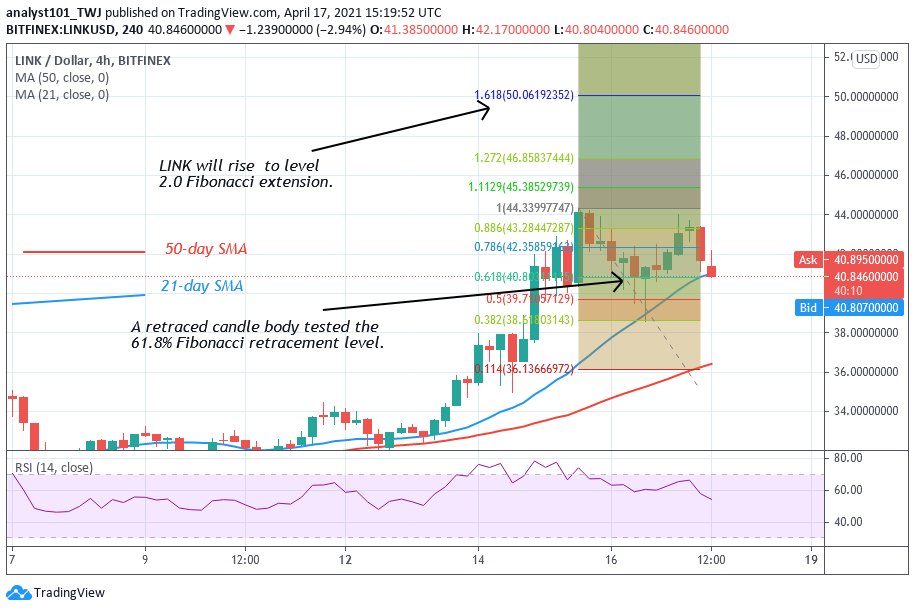
Meanwhile, the LINK price has broken below the 21-day SMA and approaching the 50-day SMA. A break below the SMAs will mean a further downward move. Meanwhile, the Fibonacci tool has indicated an upward movement of prices. On April 15 uptrend; a retraced candle body tested the 61.8% Fibonacci retracement level. This retracement indicates that LINK will rise to level 1.618 Fibonacci extension. That is the high of $50.06. From the price action, the candlesticks show long tails pointing to the $38 support. It indicates that there is strong buying pressure above the $38 support.


