
Bitcoin has shown weakness after the $50,000 psychological price level was broken. Bitcoin bulls have bought the dips as buyers attempt to sustain the bullish momentum above $50,000 support. BTC/USD risks deeper correction if the $50,000 support is breached and the bearish momentum is sustained. The other altcoins namely Polkadot, Litecoin, and Chainlink are in a downward correction. The altcoins are consolidating above their respective support levels as bulls and bears meditate about the next move.
BTC/USD Major Trend: Bearish
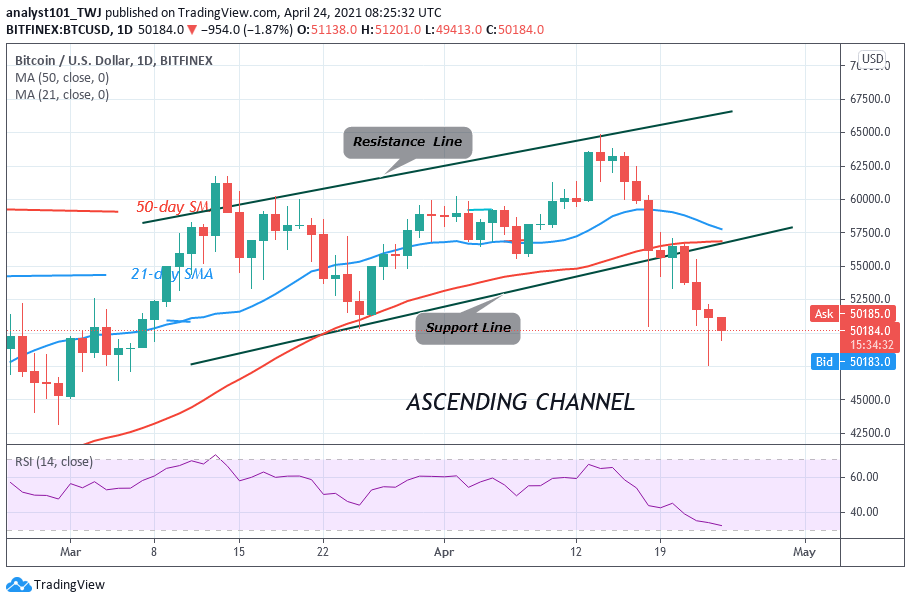
Bitcoin price has fallen and hovered above the $50,000 psychological price level. There are indications that the downtrend will continue. Bitcoin’s downward move was a result of buyers’ inability to break above the $65,000 overhead resistance. The rejection plunged BTC price to $54,000 low. The bulls bought the dips but faced rejection at the $58,000 resistance. BTC price fell and fluctuated above the $54,000 support for five days. Nonetheless, the selling pressure resumed after the bears broke the $54,000 support. Nevertheless, the price indicator has signified a further downward movement of price.
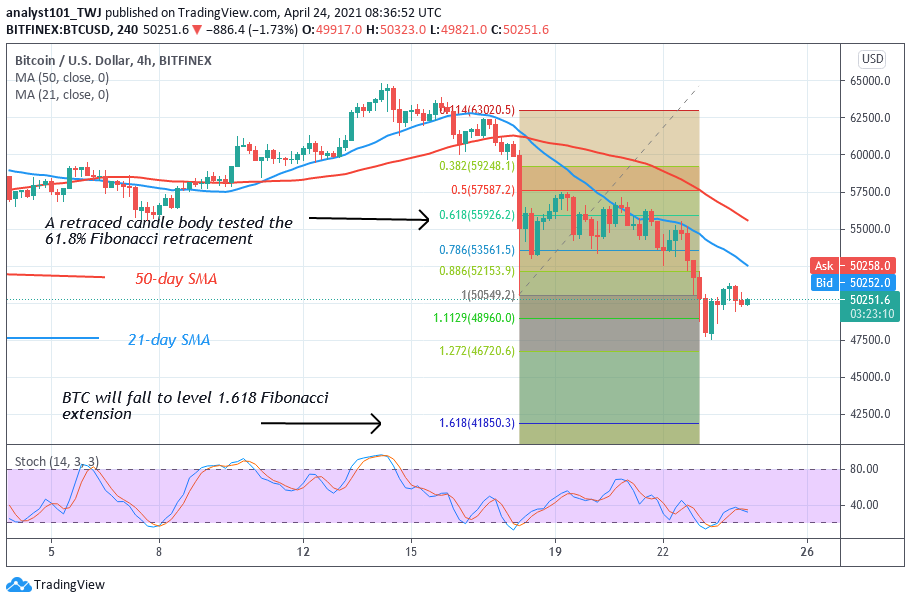
On April 18, Bitcoin price plunged to $50,500 and the bulls bought the dips. The retraced green candle body tested the 61.8 Fibonacci retracement level. This retracement gives the impression that the BTC price will fall to level 1.618 Fibonacci extensions or the low of $41,850.30. From the price action, the BTC price is fluctuating below and above $50,000 support. The king coin is likely to reach the low of $47,500. BTC/USD will resume upward if the $47,500 support holds. Otherwise, the BTC price will reach a low of $41,850.
DOT/USD Major Trend: Bearish
On April 17, DOT price had a price spike as it rallied to $48 high but it pulled back immediately on the downside. This signals the resumption of the downtrend. In the previous price action, the altcoin was resisted as it fell to $37.50 low on April 5. These rejections compelled the altcoin to fall to the previous low. Polkadot fell to the support at $27.50 and pulled back. In today’s candlestick, the candlestick possesses a long tail and it is pointing directly to the $27.50 support level. The long tail implies that there is strong buying pressure at the current support.
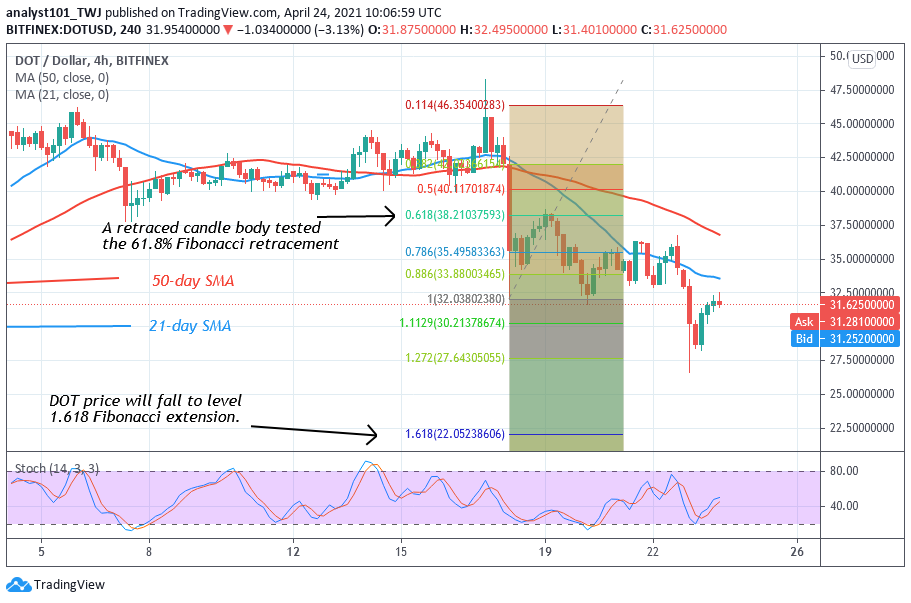
If the current support holds, the crypto is likely to be range-bound between $27.50 and $45.Meanwhile, on April 18 downtrend; the crypto fell to the low of $32. The retraced candle body tested the 61.8% Fibonacci retracement. This indicates that the market will fall to level 1.618 Fibonacci extension or the low of $22.05. From the price action, DOT price fell to the $28 support and resumed upward. Nevertheless, if the altcoin faces rejection, then we will have another round of selling pressure.
LTC /USD Major Trend: Bearish
On the daily chart, Litecoin has fallen to the support of the 50-day SMA. The bottom line is that if the 50-day SMA is breached, LTC/USD will fall to the bearish trend zone. The 21-day SMA has already been breached. The altcoin may resume another round of selling pressure. In the previous price action, Litecoin rallied to $335 high. However, the altcoin was repelled at the $340 resistance zone. The crypto plunged to the support above $250 and resumed a range-bound movement.
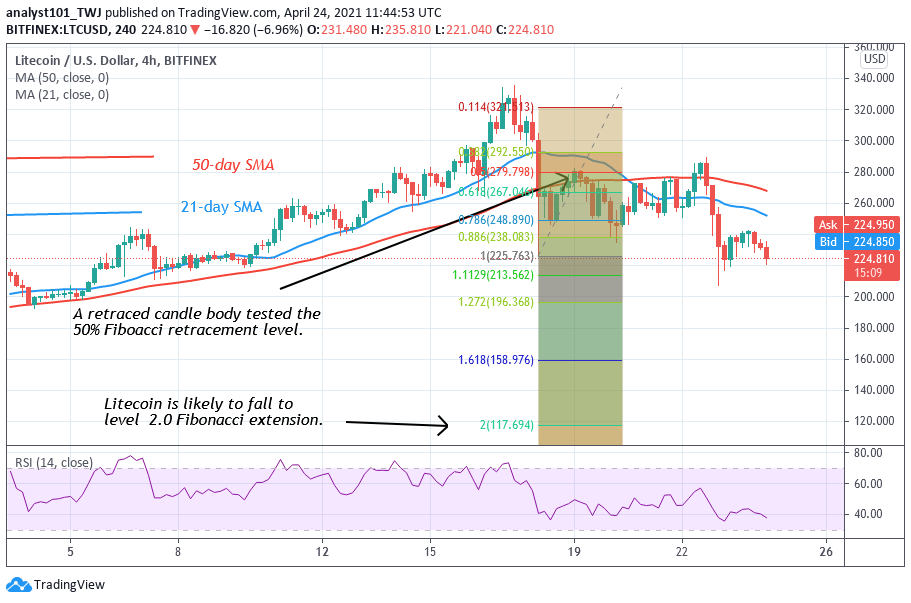
On April 18, the altcoin fluctuated between $250 and $280 before the bears broke the $250 support level. The Fibonacci tool has indicated a further downward movement of prices. On April 18 downtrend; a retraced candle body tested the 50% Fibonacci retracement level. The retracement implies that the crypto will fall to level 2.0 Fibonacci extension or the low of $117.69.
LINK /USD Major Trend: Bearish
For the past week, Chainlink has been in a downward move. Today, the crypto fell and found support above 50-day SMA. Nevertheless, if the bears break below the 50-day SMA, the downtrend will resume. On the other hand, the selling pressure will be over if the support holds. In the previous week, the altcoin fell to the low of $31 as bulls bought the dips. On April 20, the buyers attempted to push the altcoin above the $40 high but faced rejection. On April 18, the altcoin fluctuated between levels $35 and $42 for five days before resuming the downtrend.
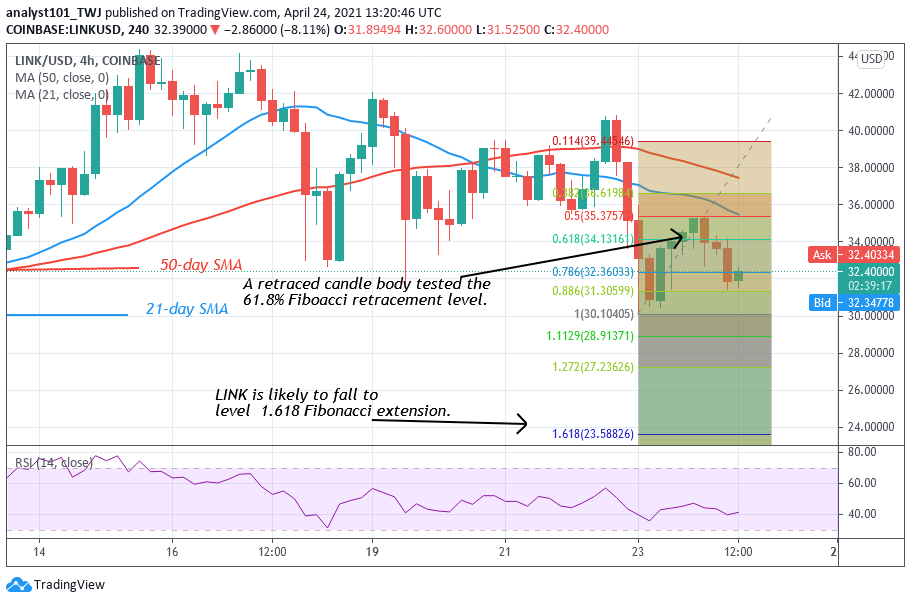
The bears broke below $35 to reach the low of $30. Today, the downtrend is resuming after price corrected upward to retest the $35 high. According to the Fibonacci tool, there is a possibility of further downward movement of prices. On April 23 downtrend; a retraced candle body tested the 61.8% Fibonacci retracement level. This retracement indicates that LINK will fall to level 1.618 Fibonacci extension or the low of $23.58.


