
On April 2, Bitcoin bulls fail to sustain the bullish momentum above the $60,000 psychological price level after breaching the resistance level. Consequently, the king coin fell on the downside to resume a downward correction. Presently, Bitcoin has fallen below the crucial support level at $58,000. The implication is that further retest at the $60,000 overhead resistance is unlikely. Polkadot makes impressive moves as price breaks the overhead resistance. Litecoin and Chainlink are in a downward correction.
BTC/USD Major Trend: Bullish
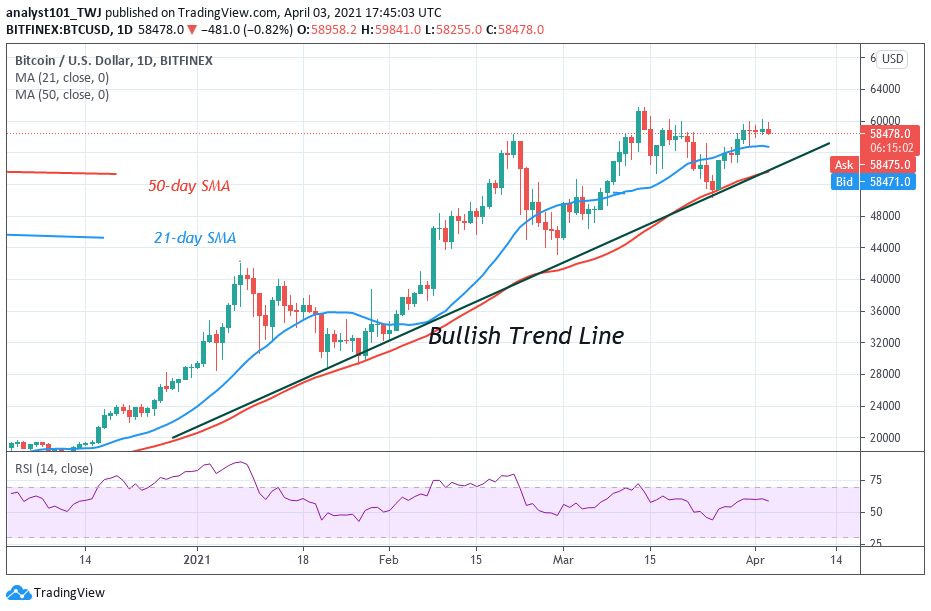
For the past four days, BTC price has been forming small body candlesticks called Doji and Spinning Tops. These candlesticks are describing that buyers and sellers are undecided about the direction of the market. In other words, Bitcoin is likely to be range-bound for a few days for failing to break the overhead resistance. In the previous price action, the BTC price fell to the low of $50,350 as bulls buy the dips on March 26. The resultant uptrend retested the $60,000 overhead resistance and broke it. However, the bulls failed to sustain the bullish momentum. The BTC price was rejected after reaching a high of $60,190.
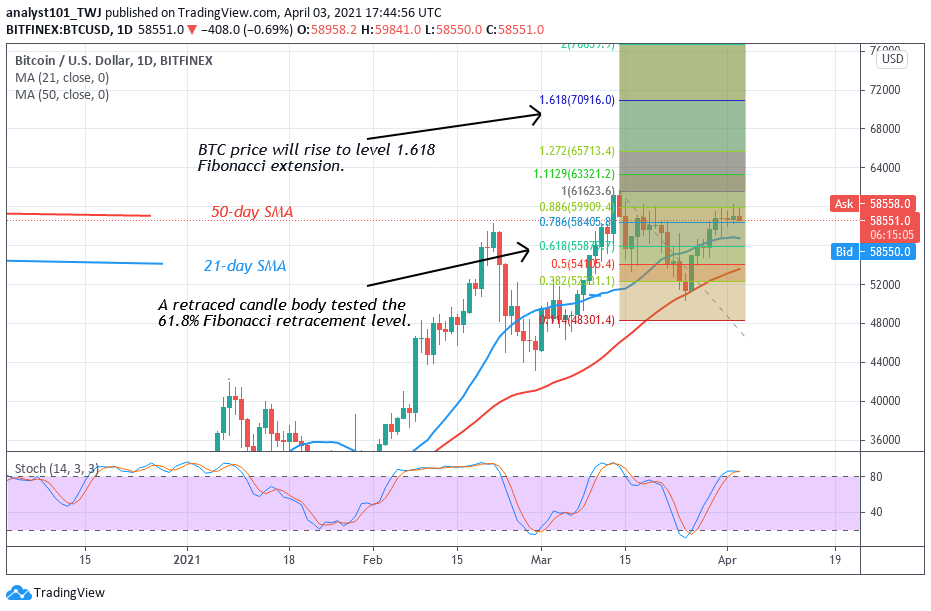
On the downside, if the bears break the $58,000 support, the king coin will resume a downward move. Nonetheless, if bulls defend the current support above $58,000, buyers will continue to retest the overhead resistance. On the upside, if buyers clear the $60,000 and $61,800 resistance, the market will resume upside momentum. The price indicator has indicated an upward move of Bitcoin. In the uptrend of March 13, a retraced candle body retested the 61.8% Fibonacci retracement. This retracement implies that the BTC price will rise to level 1.618 Fibonacci extension or the high of $70,916.0
DOT/USD Major Trend: Bullish
DOT price has broken the $40 overheard resistance as price resumed the uptrend. The market has been in a sideways trend since February 20 when the previous trend was terminated. Today, DOT has resumed a fresh uptrend to revisit the previous highs. In the previous price action, DOT was range-bound between $28 and $40 since February 20.
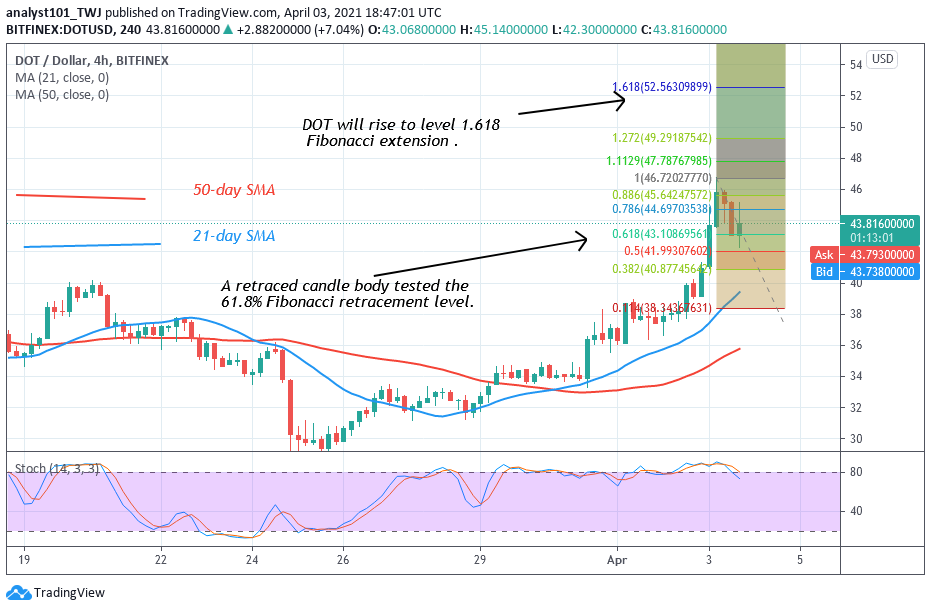
The altcoin slumped to the lower price range and later resume upward. The upward move has paid off as price broke the resistance level. The altcoin will rise to a high of $52 if the bullish momentum is sustained. The Fibonacci tool has indicated an upward move of price. In the uptrend of April 3, a retraced candle body retested the 61.8% Fibonacci retracement. This retracement indicated that the market will rise to level 1.618 Fibonacci extension or the high of $52.56.
LTC /USD Major Trend: Bullish
Litecoin is falling after retesting the high of $217. For the past week, the altcoin has been in an upward move. The current uptrend is facing resistance at the $210 price level. Buyers would have pushed LTC to retest the $230 high if the bullish move is sustained. However, the current uptrend is doubtful as price reaches the overbought region of the market. Sellers may emerge to push prices down.
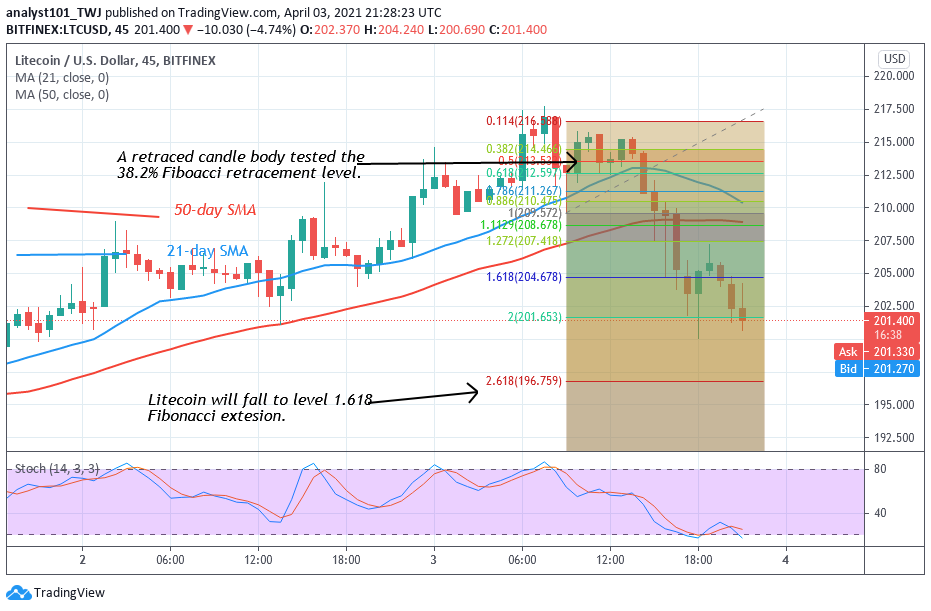
LTC price has turned down from the recent high; the market may fall to the previous range bound zone between $195 and $210. The Fibonacci tool has indicated a downward movement of prices. On the downtrend on April 3, a retraced candle body tested the 38.2% Fibonacci retracement level. The retracement implies that LTC will fall to 2.618 Fibonacci extension or the low of $196.75.
LINK /USD Major Trend: Ranging
The LINK price is falling after retesting the $33 high. Since February 23, the altcoin has been range-bound between $24 and $32 price levels. The current price fall is approaching the lower price range. Buyers fail to breach the resistance level at $32. This resulted in the downward movement of the coin. LINK is approaching the lower price range on the downside.
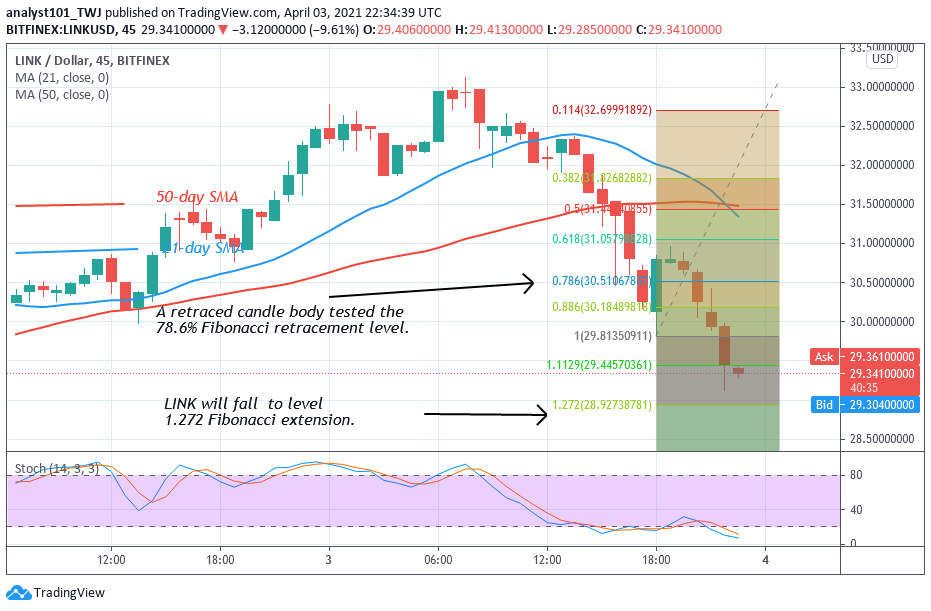
If the altcoin finds support at the lower price range, the range movement will continue to linger. Otherwise, the market will resume a downtrend. The Fibonacci tool has indicated a downward movement of the coin. On April 3, a retraced candle body tested the 78.6% Fibonacci retracement level. At this retracement, LINK is expected to drop to level 1.272 Fibonacci extension or level $28.92. At level 1.272 Fibonacci extension, LINK is expected to reverse and return to 78.6% Fibonacci retracement where it originated.


