
Bitcoin (BTC) and the altcoins below have fallen below the moving averages as the cryptos faced rejection at their respective resistance levels. Bitcoin has resumed downward correction along with the altcoins as buyers attempt recovery. Recovery will be achieved if price breaks above the moving averages.
BTC/USD Major Trend: Bearish
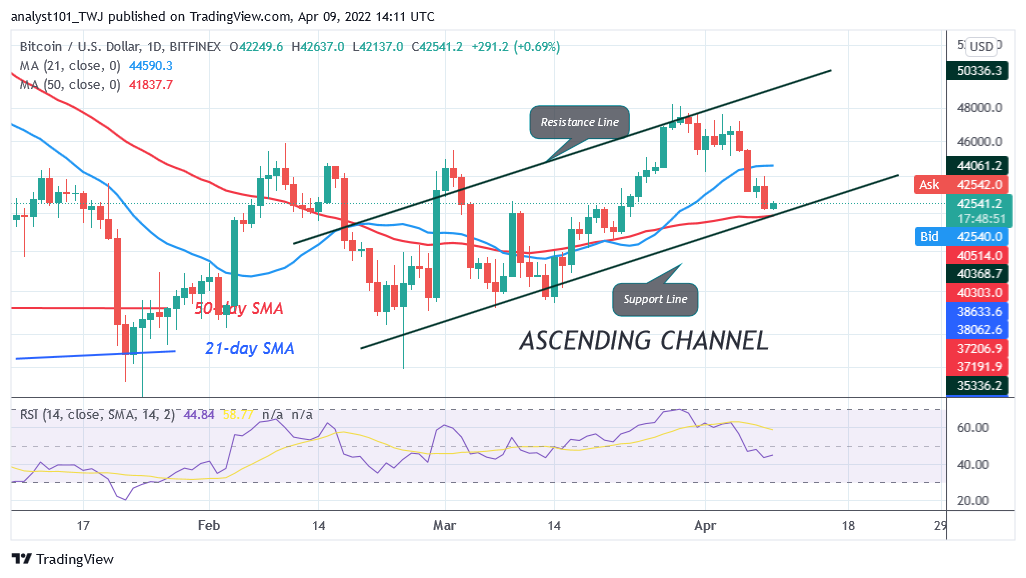
Bitcoin’s (BTC) price has fallen below the moving averages. The largest cryptocurrency declined below the 21-day line SMA but above the 50-day line SMA. This implies that Bitcoin will commence a range-bound move between the moving averages. Presently, the BTC price is trading at $42,755 at the time of writing. On the downside, if sellers break below the 50-day line SMA, BTC/USD will decline to $37,577 low. Meanwhile, on April 7 downtrend; a retraced candle body tested the 78.6% Fibonacci retracement level.
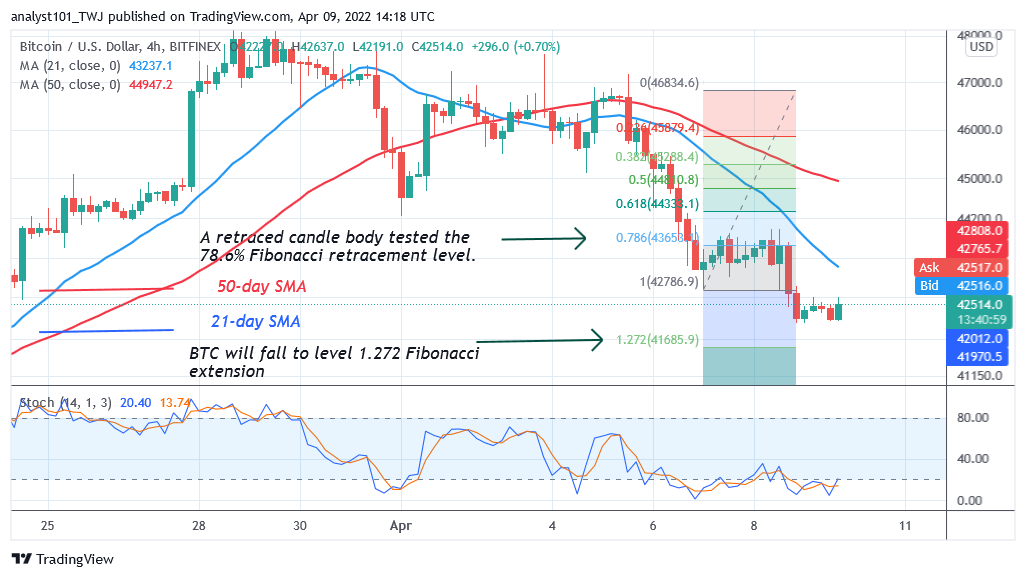
The retracement indicates that the BTC price will fall but reverse at level 1.272 Fibonacci extension or $41,685.90. From the price action, Bitcoin has reversed after falling to the low of $42,137. On the upside, if buyers defend the $42,000 support, the BTC price will rebound above the current support. A break above the 21-day SMA will propel BTC price will to rally to $48,000 overhead resistance. Bitcoin will resume upside momentum if the overhead resistance is breached. The market will rally above the $50,000 psychological price level.
XRP/USD Major Trend: Bearish
Ripple’s (XRP) price has broken below the moving averages to reach the low of $0.74. This is an indication that the market will further decline to the previous low. On the 4-hour chart, the 21-day line SMA is acting as resistance to XRP price. The crypto’s price is making a series of lower highs and lower lows.
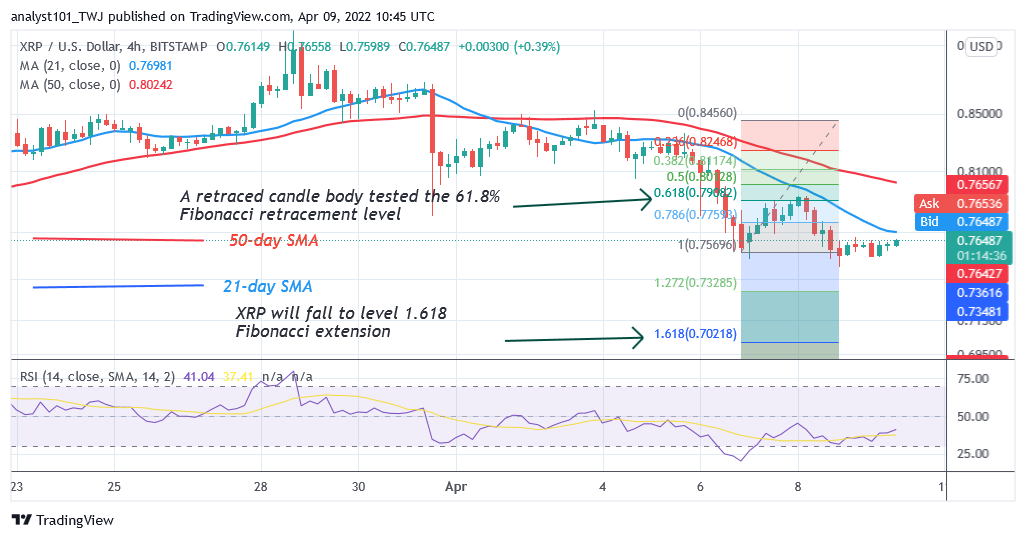
Meanwhile, on April 6 downtrend; a retraced candle body tested the 61.8% Fibonacci retracement level. The retracement indicates that XRP will fall to level 1.618 Fibonacci extension or $0.70. From the price action, the market has reached a high of $0.76.Today, the altcoin is likely to further decline as it faces rejection at the 21-day line SMA.
DOT/USD Major Trend: Bearish
Polkadot’s (DOT) price has resumed a downward move as the cryptocurrency faces rejection from the $23 resistance. From the rejection at the $23 high, the altcoin has broken below the moving averages to reach the low of $19.11. The altcoin broke below the 21-day line SMA but above the 50-day line SMA. DOT price has found support above the $19 low. The implication is that DOT/USD will commence a range-bound move between the moving averages.
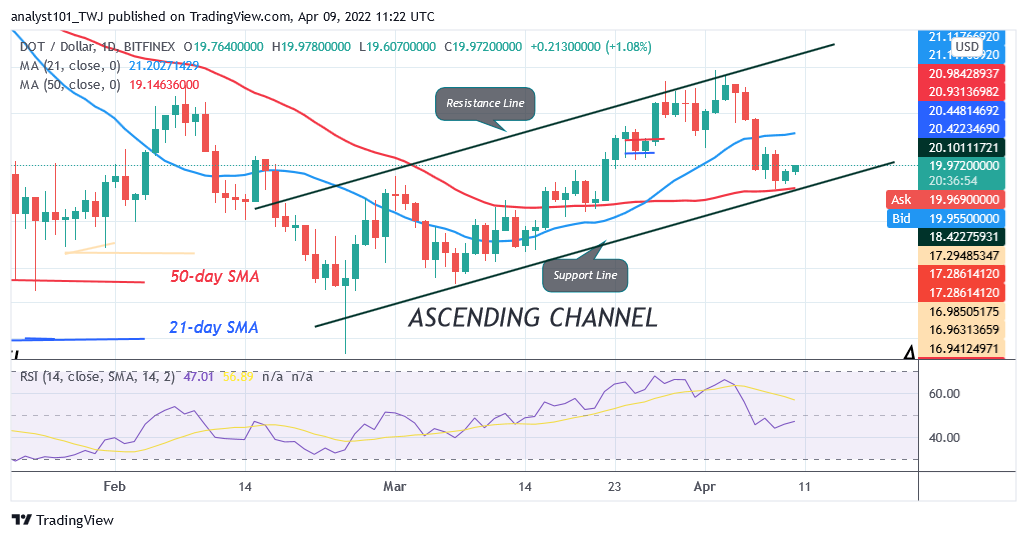
Polkadot will resume trending when the moving averages lines are breached. For instance, if the bulls break above the 21-day line moving average, the market will retest or rally above the $23 resistance. A break above the $23 high will catapult the altcoin to the high of $28. However, the downtrend will resume, if the bears break below the 50-day line SMA.
LTC /USD Major Trend: Bearish
Litecoin’s (LTC) price has resumed downward correction as price breaks below the moving averages. The cryptocurrency fell to the low of $109 and resumed consolidation above the current support. Meanwhile, on April 1 downtrend; a retraced candle body tested the 50% Fibonacci retracement level.
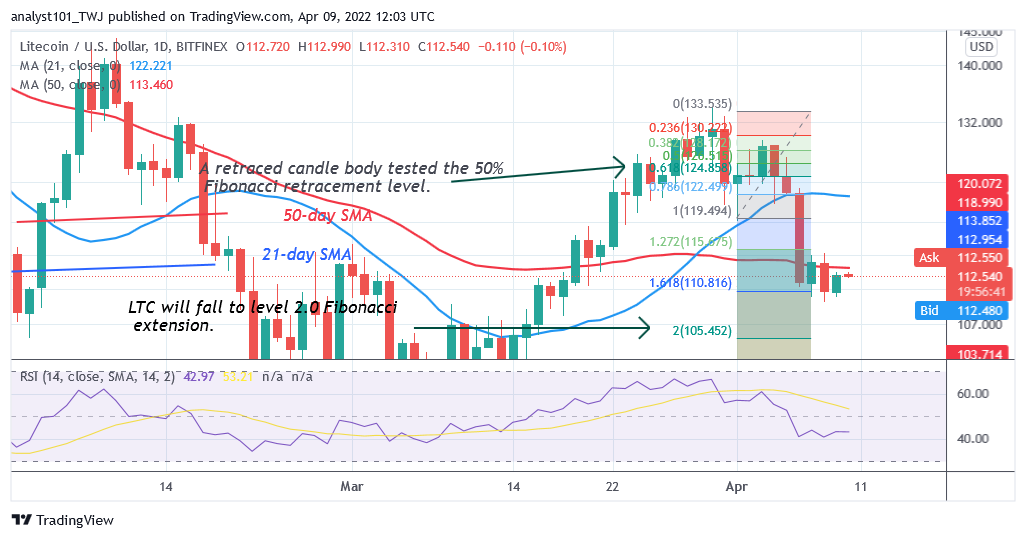
The retracement suggests that the LTC price will fall to level 2.0 Fibonacci extension or $105.45. From the price action, Litecoin is rising and approaching the 50-day line SMA. The downtrend will resume if the altcoin faces rejection at the 50-day line SMA. Litecoin will revisit the previous low of $96 and $105. On the other hand, if the bulls break above the 50-day line SMA, it will signal the resumption of the uptrend.
LINK /USD Major Trend: Bearish
Chainlink’s (LINK) price faces rejection at the $18 high as the altcoin plunges below the moving averages. On the daily chart, LINK/USD is trading above the 50-day line SMA but below the 21-day line SMA. The implication is that Chainlink will commence a range-bound move between the moving averages.
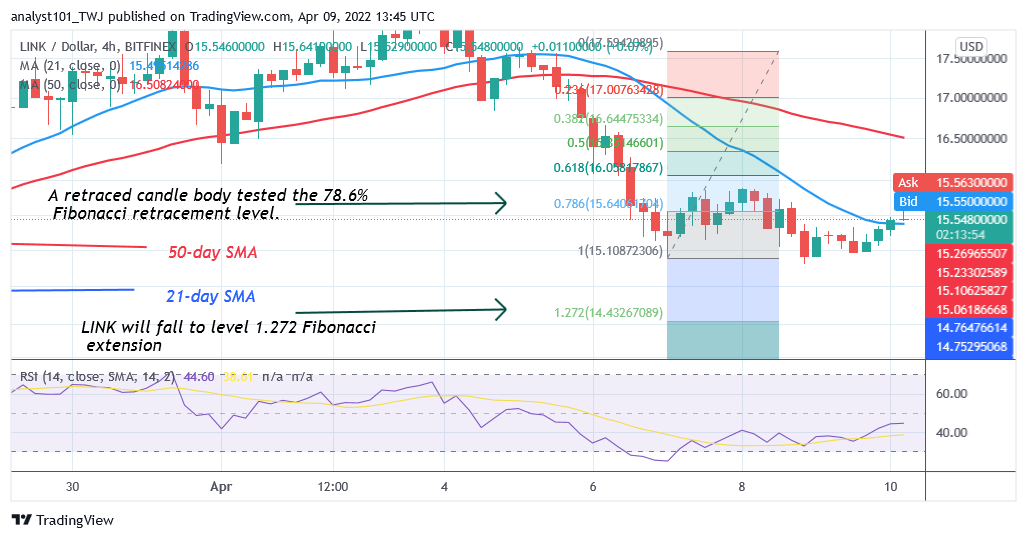
The market will trend when the moving average lines are breached. For instance, if the bulls break above the 21-day line SMA, Chainlink will retest or rally above the $18 high. Similarly, the altcoin will further decline to $13 low, if the bears break below the 50-day line SMA. Meanwhile, on April 7 downtrend; a retraced candle body tested the 78.6% Fibonacci retracement level. The retracement indicates that LINK will fall to level 1.272 Fibonacci extension or level $14.43. From the price action, the market is reversing after falling to the low of $15.


