
Bitcoin bulls have sustained recent rallies as the crypto battles the resistance at $48,000 to resume upside momentum. The bullish scenario is likely to be achieved if buyers sustain hold above the $46,000 support. The other altcoins are making positive moves in the bullish trend zones. However, the altcoins are grappling with the overbought conditions of the market.
BTC/USD Major Trend: Bullish
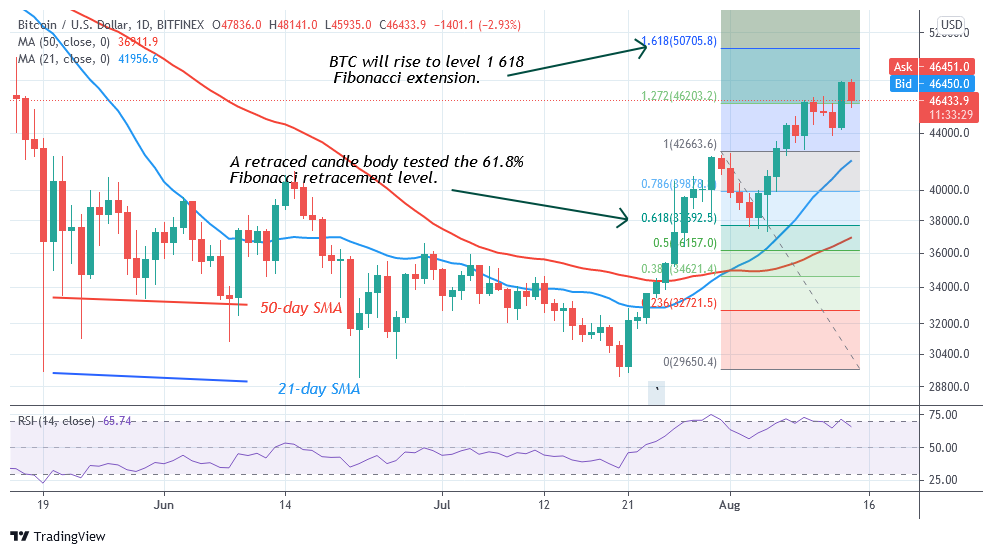
For the past 48 hours, BTC/USD has been in a downward correction after Bitcoin was rejected at the $48,000 high. BTC price retraced to the $45,935 support and resumed consolidation above it. Presently, the bearish momentum has subsided as Bitcoin found support above the 21-day SMA. Bitcoin will resume an upward move if the current support holds. A retest at the $48,000 resistance is likely. On the upside, a breakout above the $48,000 resistance will catapult Bitcoin to rally above the $50,000 psychological price level.
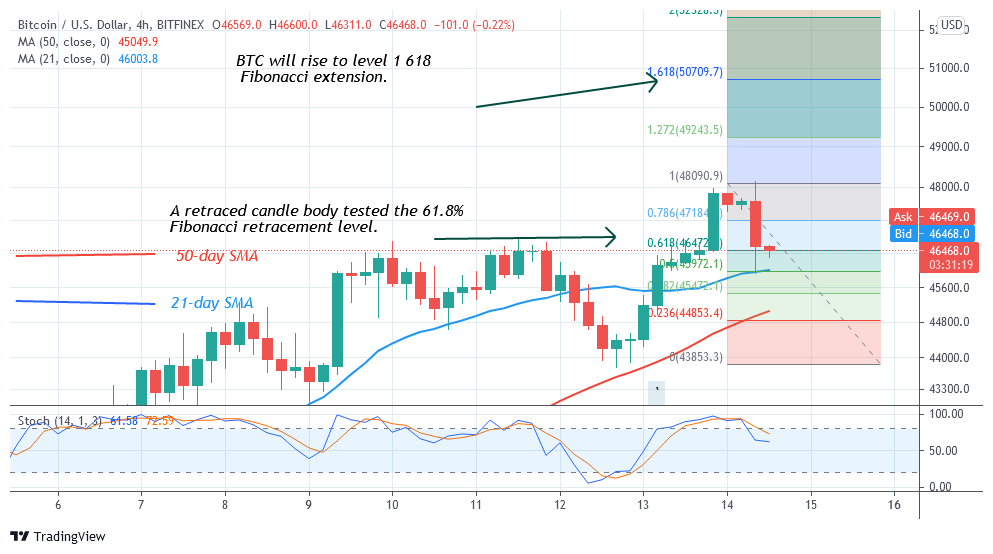
The bullish momentum will extend above the $51,000 high. In the meantime, Bitcoin is still in a bearish momentum as it is above $45,800 support. The selling pressure will resume if the bears break below the current support. The downtrend will resume if price breaks below $38,000. In the meantime, BTC’s price is trading above $46,646 at the time of writing. Meanwhile, on August 14 uptrend; a retraced candle body tested the 61.8% Fibonacci retracement level. The retracement indicates that Bitcoin will rise to level 1.618 Fibonacci extensions or level $50,709. 70. From the price action, BTC’s price is consolidating above the current support but yet to resume an upward move.
XRP/USD Major Trend: Bullish
On August 13, Ripple’s (XRP) price broke the resistance at $1.08 as the market rallied to $1.33 high. There is a likelihood of further upsides. In the first uptrend, buyers were stopped at the $1.08 resistance. After two days of correction, the bulls broke the resistance at $1.08 as the market reaches above the previous high. Today, the market has risen to $1.33 high.
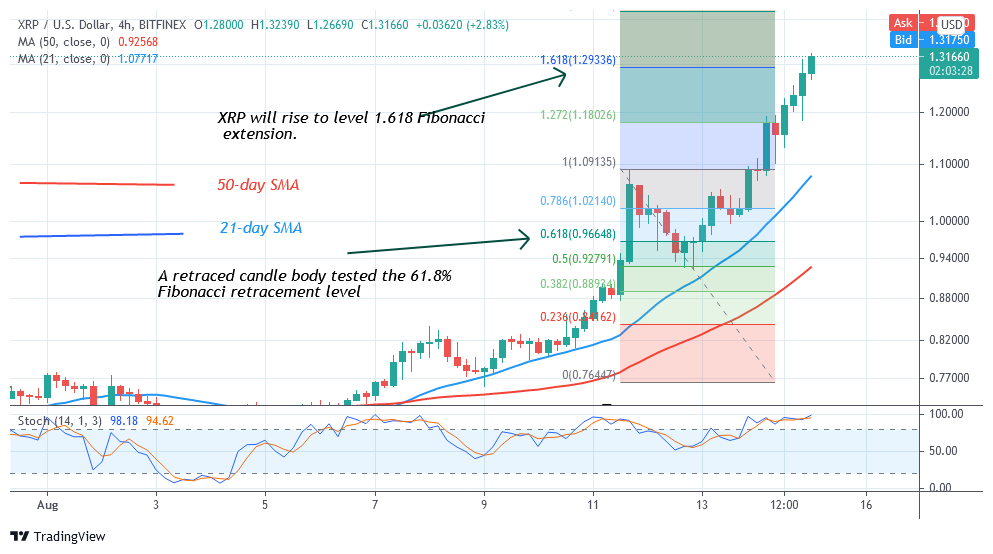
Nevertheless, XRP has been trading in the overbought region of the market. The RSI and the daily stochastic have shown the overbought condition of Ripple. It is not clear if the upward move will continue. Meanwhile, on August 11 uptrend; a retraced candle body tested the 61.8% Fibonacci retracement level. The retracement indicates that Ripple is likely to rise to level 1.618 Fibonacci extension or level $1.29. From the price action, Ripple has retested the 1.618 Fibonacci extension and further upsides are likely.
DOT/USD Major Trend: Bullish
For the past 48 hours, Polkadot’s (DOT) uptrend is stalled at the high of $22. On August 14, DOT price upward move was repelled as the altcoin resumed sideways move below the recent high.
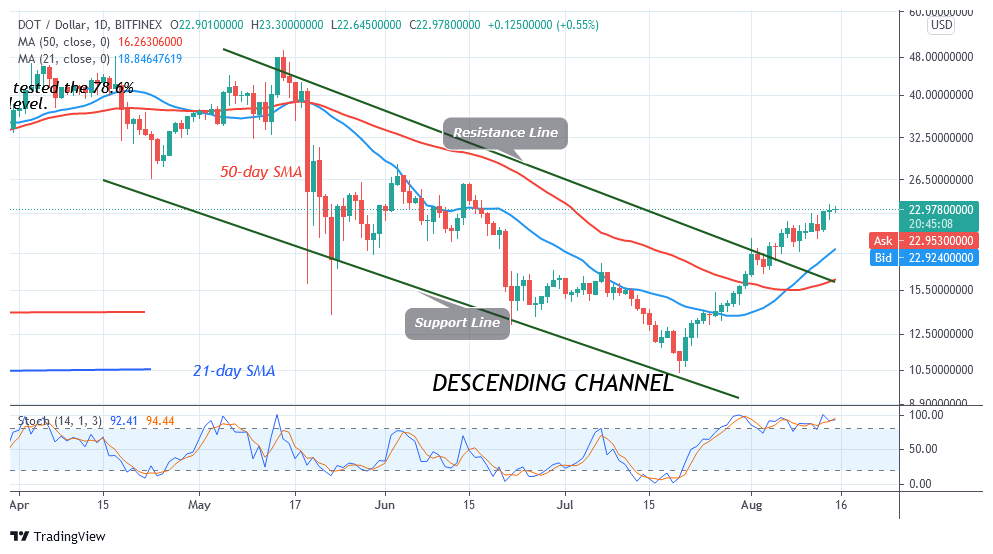
The crypto fell to $22 low but it is fluctuating between $22 and $22.92. Polkadot’s (DOT) will resume upward move if the bulls clear the $23 resistance zone. On the other hand, if the bears break below the $22 support, the selling pressure will resume. Besides, the crypto has been trading in the overbought region since July 29. There is a likelihood of sellers emerging in the overbought region to push prices down. Meanwhile, the DOT price is trading at $22.96 at the time of writing.
LTC /USD Major Trend: Bullish
Litecoin’s (LTC) is in an uptrend. Since August 13, the altcoin upward move has been stalled below the $180 resistance. Buyers have partially broken above the resistance but face stiff resistance above the recent high.
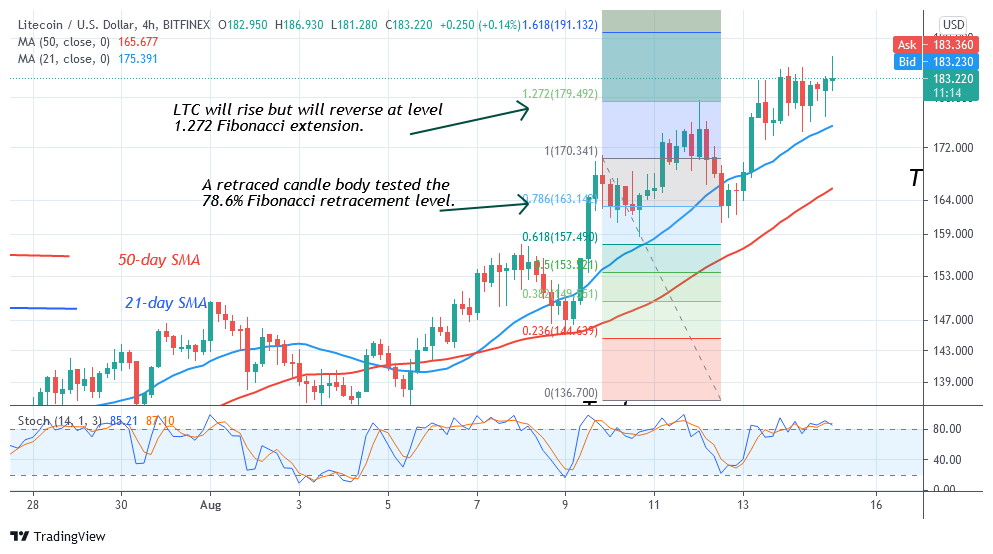
Litecoin is fluctuating below and above the $180 high. The uptrend will resume if price breaks above the resistance and the bullish momentum is sustained. Meanwhile, on August 9 uptrend; a retraced candle body tested the 78.6% Fibonacci retracement level. This retracement indicates that the market will rise to level 1.272 Fibonacci extensions or level $179.49 and reverse. From the price action, the LTC price has retested the 1.272 Fibonacci extensions but it is fluctuating below the resistance level.
LINK /USD Major Trend: Bullish
Chainlink’s (LINK) price is in an upward move. Since August 13, the uptrend has been terminated at the high of $27. For the past three days, the crypto has been fluctuating below the recent high. Chainlink will rise to $35 if buyers are successful above the resistance level.
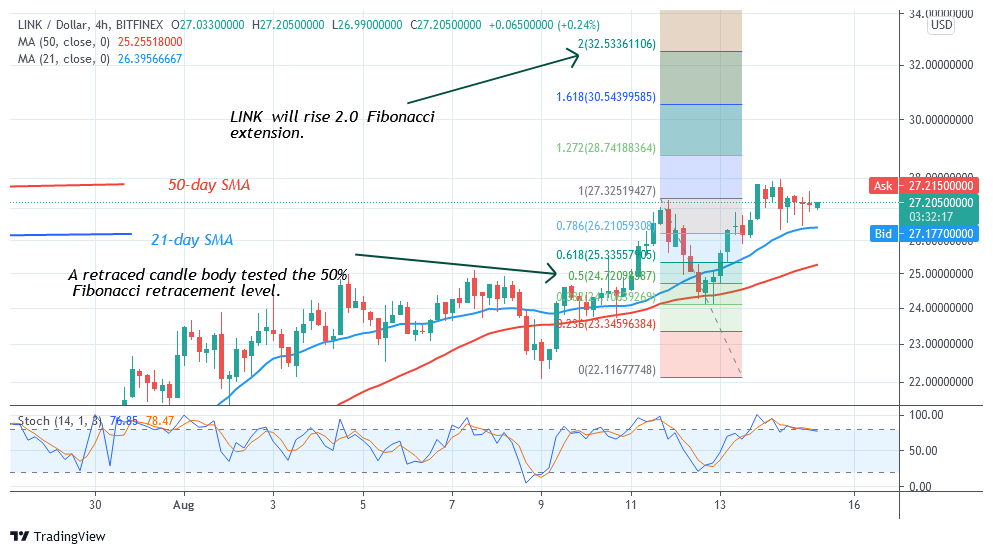
However, if LINK/USD turns from the recent high; the market will decline to $22 low. Meanwhile, on the August 11 uptrend, a retraced candle body tested the 50% Fibonacci retracement level. The retracement indicates that LINK will rise to 2.0 Fibonacci extension or level $32.53. From the price action, buyers are still struggling to break above the $27 high. This week the upward move is doubtful as the market reaches the overbought region


