
Bitcoin’s (BTC) price has made positive moves after breaking above the $48,000 resistance. The crypto has retested the $50,000 high twice but was resisted. The king coin is likely to rally to $51,000 high but will face stiff resistance. The other altcoins like Ripple, Polkadot, Litecoin, and Chainlink are likely to move up as Bitcoin rises.
BTC/USD Major Trend: Bullish
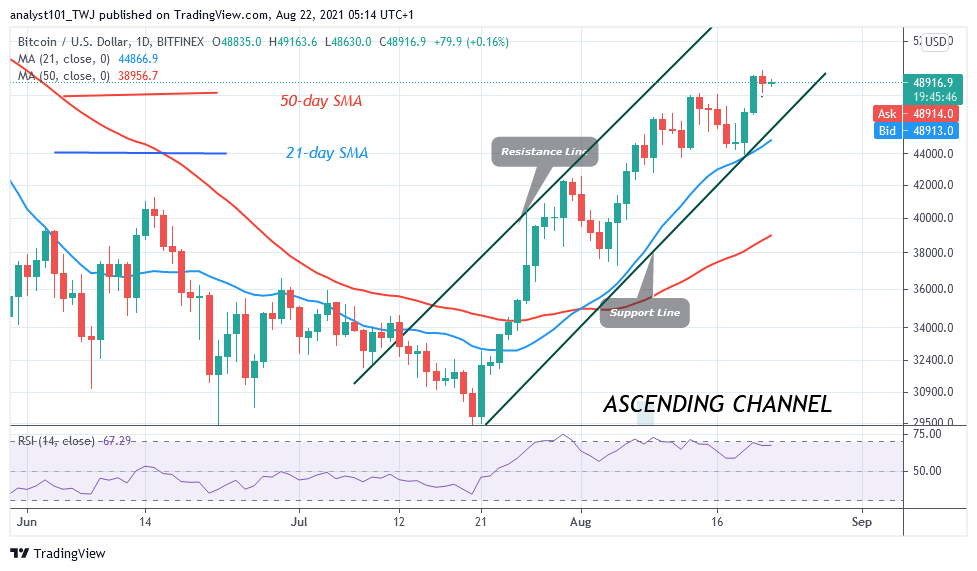
Bitcoin’s (BTC) price is now retesting the $50,000 psychological price level. In the first and second attempts, buyers pushed BTC prices to the highs of $49,400 and $49,788 but were repelled. Bitcoin is capable of rallying to the $55,000 high if the bulls clear the $50,000 psychological price level. Meanwhile, in the second rejection, BTC price slumped to $48,800 low and corrected upward to $49,243. However, Bitcoin was rejected at the $49,243 high. The implication is that the Selling pressure may continue to the low of $48,000 support.
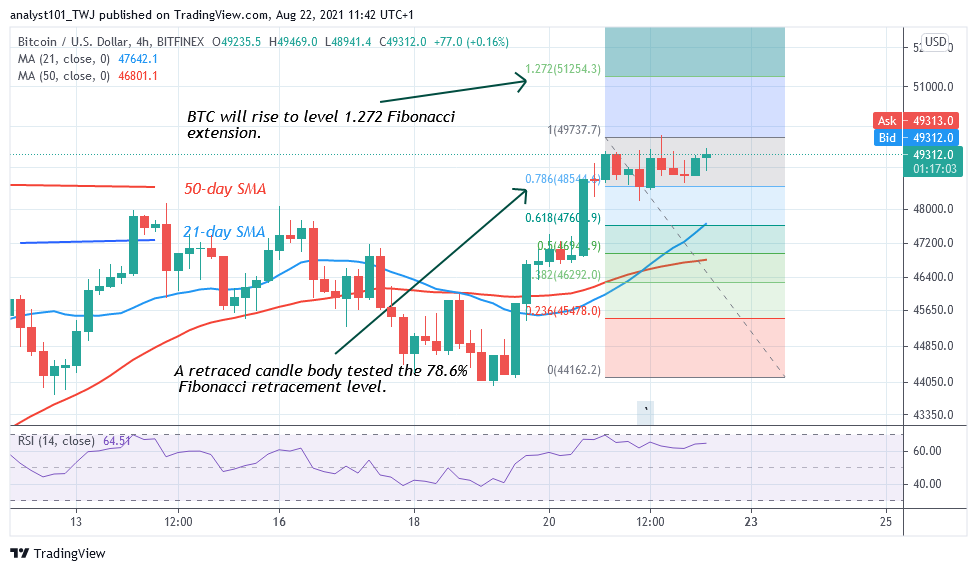
The downtrend will resume if the bears break below the $48,000 support. On the other hand, the uptrend will resume if the $48,000 support holds. BTC/USD is trading at $49,138 at the time of writing. The current selling pressure has subsided. Meanwhile, on the August 20 uptrend; a retraced candle body tested the 78.6% Fibonacci retracement level. The retracement indicates that BTC will rise to level 1.272 Fibonacci extension or level $51.254.30.
XRP/USD Major Trend: Bullish
As of August 15, Ripple’s (XRP) price has rallied and attained the high of $1.34 but the bulls could not sustain the bullish momentum above the recent high. For the past week, XRP has been fluctuating between $1.05 and $1.34. Today, the XRP price is at $1.24 consolidating near the resistance level.
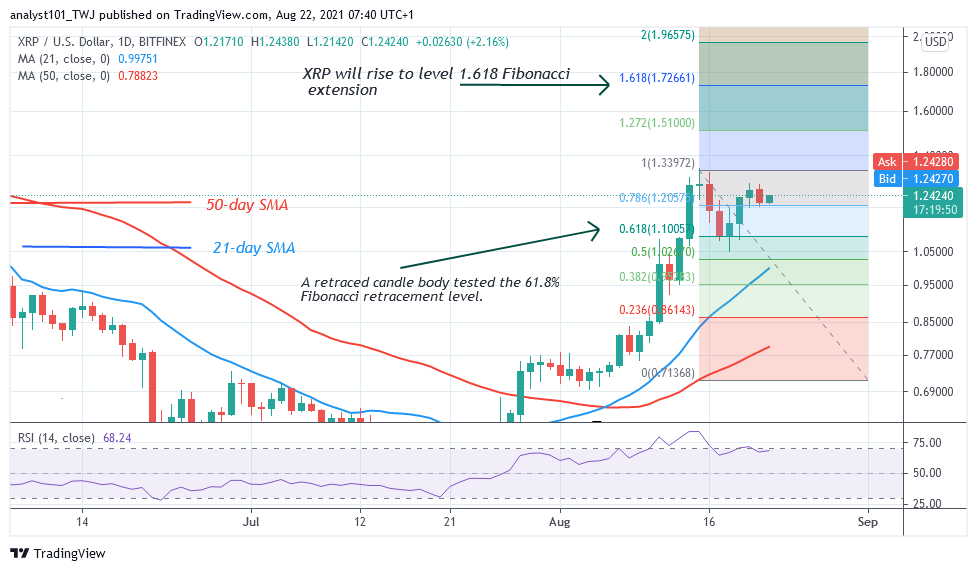
Ripple is expected to rise if the bulls break the current resistance at level $1.34. On the upside, XRP will rally to $1.72 if the bulls break the recent high. Similarly, if buyers fail to break the resistance level, the crypto will be compelled to a sideways move below the resistance level. However, if the bears break the $1.05 support, XRP/USD will decline to the low of either $0.80 or $0.90. Meanwhile, on August 15 uptrend; a retraced candle body tested the 61.8% Fibonacci retracement level. The retracement indicates that Ripple is likely to rise to level 1.618 Fibonacci extension or level $1.72.
DOT/USD Major Trend: Bullish
Polkadot’s (DOT) price is struggling to break above $28.50 high. On August 21, the altcoin rallied to $29.35 but could not sustain the bullish momentum above it. For the past 48 hours, DOT/USD has been in a downward correction as buyers and sellers continue price tussle.
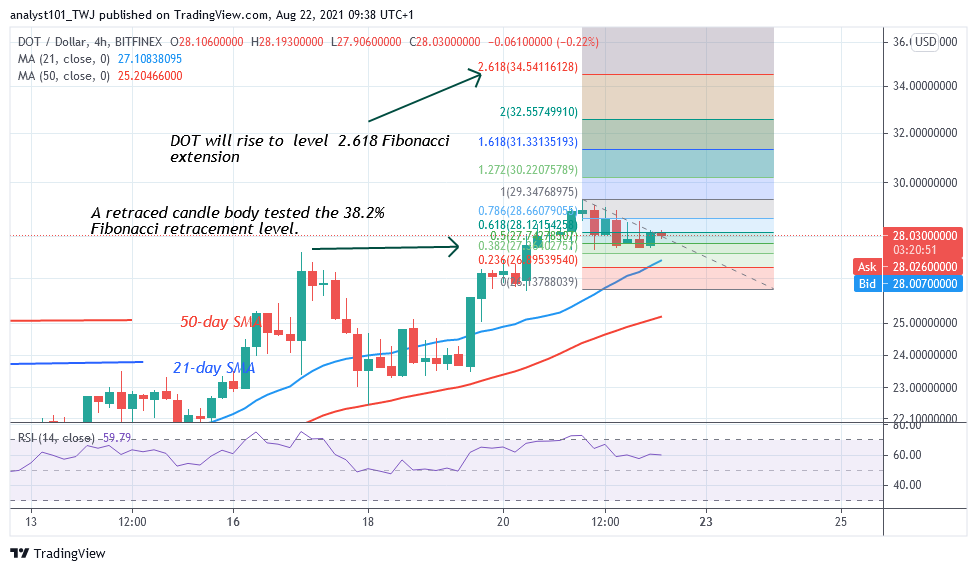
On the upside, if buyers break above the resistance at $28.5 and $29.35, the crypto will rally to $35 high. However, if buyers fail to break the recent high, Polkadot will decline on the downside. Sellers will push the price to the next support level at $24. The uptrend will resume if the $24 support holds, otherwise, the selling pressure will continue on the downside. Meanwhile, on August 21 uptrend; a retraced candle body tested the 38.2% Fibonacci retracement level. This retracement indicates that the market will rise to level 2.618 Fibonacci extensions or level $34.54.
LTC /USD Major Trend: Bullish
Litecoin’s (LTC) price has revisited the peak price of $189 on August 22. In the first uptrend, the market reached the high of $189 but was repelled. The crypto was resisted as the market reached the overbought region.
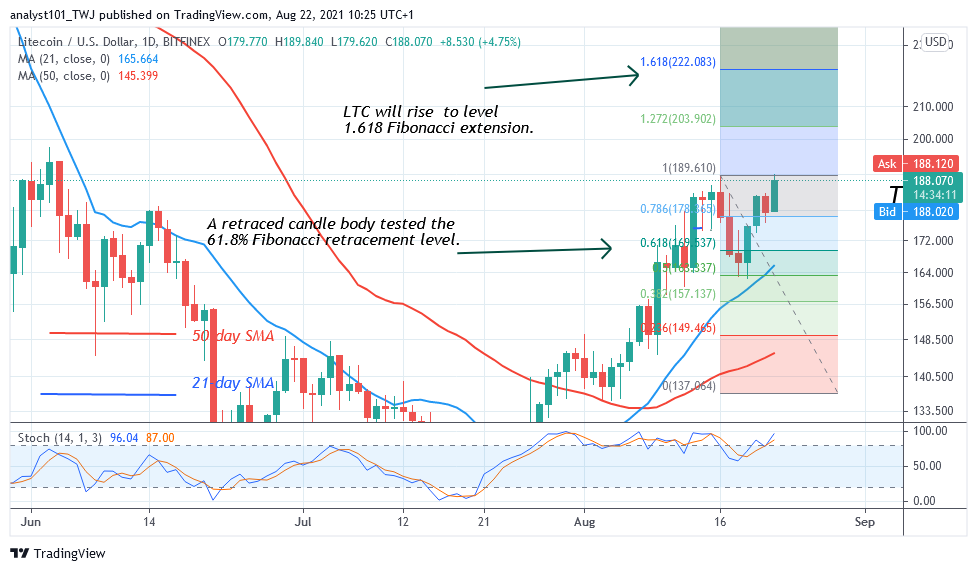
The altcoin declined to the low $164 as bulls bought the dips. Today, buyers have revisited the overbought region of the market. In a strong trending market, the overbought condition may not hold. Besides, the uptrend will resume, if the current resistance is breached. Meanwhile, on August 16 uptrend; a retraced candle body tested the 61.8% Fibonacci retracement level. This retracement indicates that the market will rise to level 1.618 Fibonacci extensions or level $222.08. From the price action, buyers are still struggling to break above the $189 resistance.
LINK /USD Major Trend: Bullish
Chainlink’s (LINK) price is rising as the market retest the previous high of $30. Today, the LTC price will be making the third attempt if it retests the $30 overhead resistance. Since August 16, buyers have failed to break above the overhead resistance.
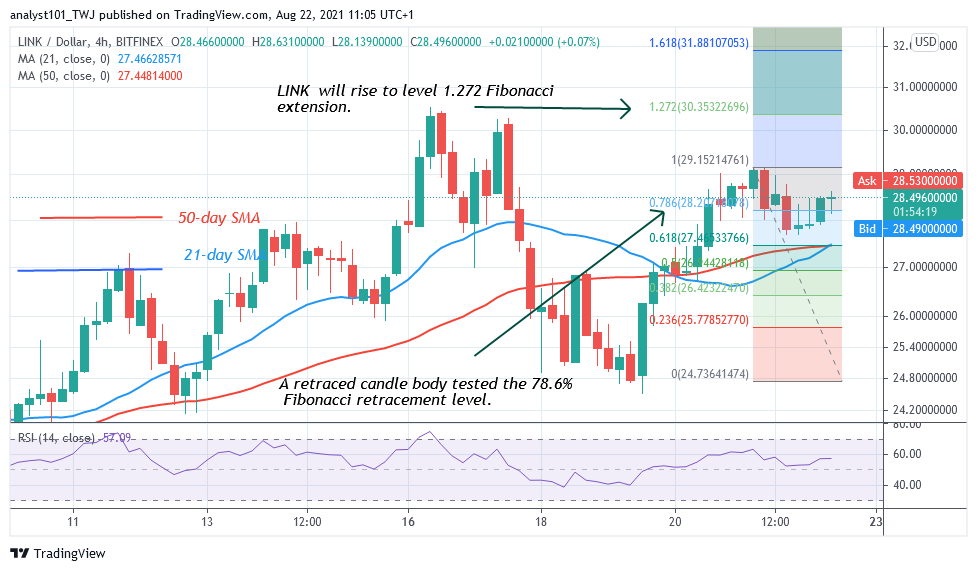
The crypto has been in a sideways move as buyers struggle below the resistance. Meanwhile, on the August 21 uptrend, a retraced candle body tested the 78.6% Fibonacci retracement level. The retracement indicates that LINK will rise but reverse at level 1.272 Fibonacci extension or level $30.35. The Fibonacci tool has indicated further sideways move for the crypto.


