
For the past three weeks, Bitcoin and the other altcoins have been in an upward move. The cryptos have broken into the bullish trend zones but the upward moves are stalled. Bitcoin and other altcoins risk a possible decline as the market reaches the overbought region.
BTC/USD Major Trend: Bullish
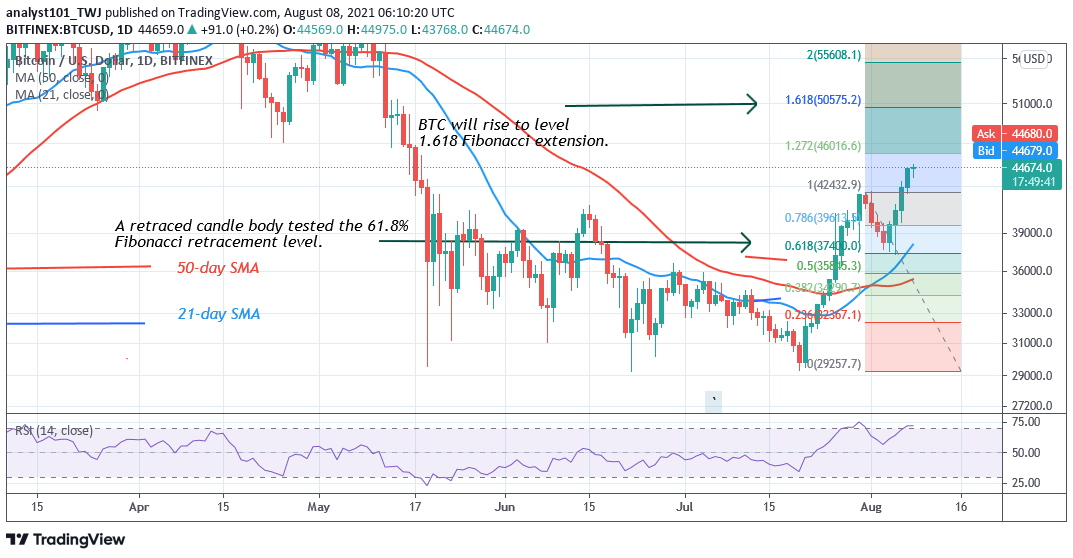
BTC/USD is trading above $44,000 support after breaking the initial resistance at $42,299.20. Today, the bulls have cleared the resistance zones from $34,400 to $42,299. On August 6, the bulls broke the resistance at $42,299 to resume upside momentum. Buyers are expected to push the crypto to the previous highs of $50,000 and $51,000. However, the uptrend will face stiff opposition at the recent high. Meanwhile, on July 31 uptrend; a retraced candle body tested the 61.8% Fibonacci retracement level.
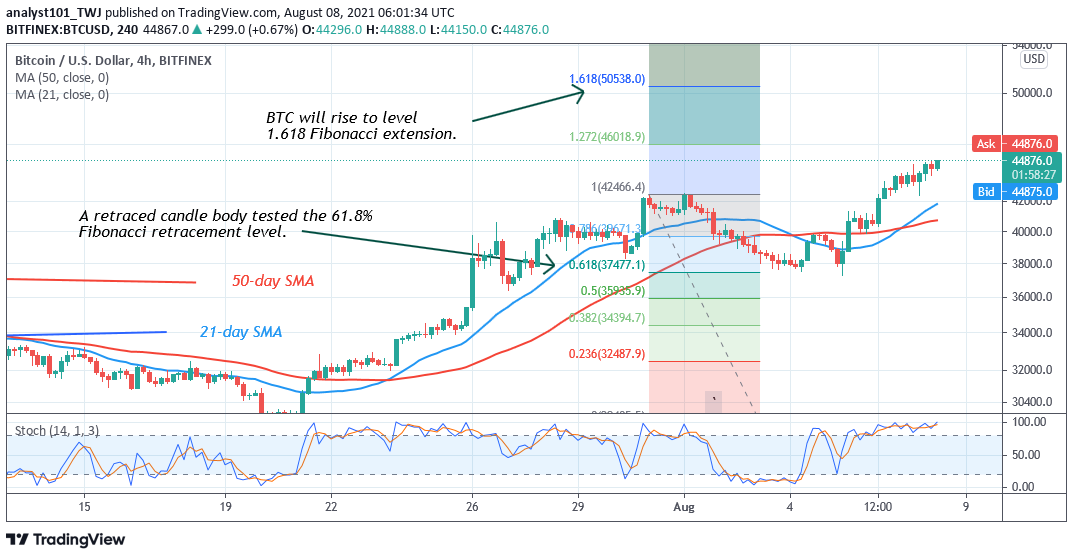
The retracement indicates that Bitcoin will rise to level 1.618 Fibonacci extensions or level $50,575.20. From the price action, BTC’s price is trading above $44,000 at the time of writing. Besides, the RSI and the daily stochastic have indicated that Bitcoin is in the overbought region of the market. The implication is that a further upward movement of the crypto is doubtful. Sellers may be attracted at the overbought region of the market. Therefore, Bitcoin reaching a high of $50,000 is doubtful.
XRP/USD Major Trend: Bullish
Since July 21, Ripple has been in an upward move as price breaks above the moving averages. In the first uptrend, Ripple’s (XRP) price attained a high of $0.77 and but was repelled. The altcoin retraced to a $0.70 low and resumed a sideways move between $0.70 and $0.77. Nonetheless, after six days of correction, the bulls broke the $0.77 resistance.
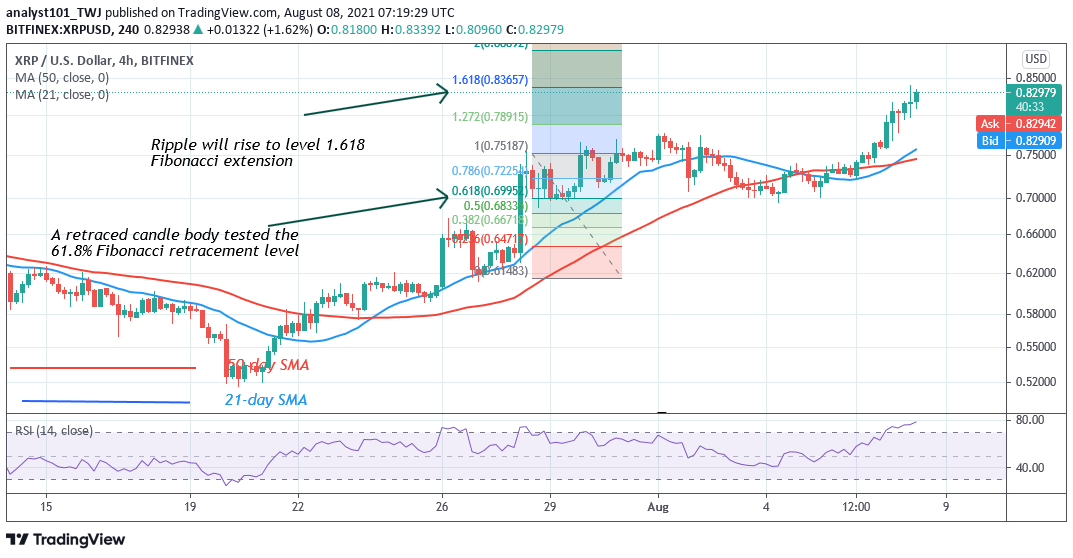
Buyers have pushed XRP above the $0.77 high as the market reaches the high of $0.82. If the current bullish momentum is sustained, XRP will rise to $0.85 or $1.07. Meanwhile, on July 28 uptrend; a retraced candle body tested the 61.8% Fibonacci retracement level. The retracement indicates that Ripple is likely to rise to level 1.618 Fibonacci extension or level $0.83. From the price action, XRP has reached the 1.618 Fibonacci extensions. However, further upward movement is not clear as the crypto reaches the overbought region of the market.
DOT/USD Major Trend: Bullish
Polkadot’s (DOT) price has risen to the $22 high but the crypto is facing rejection at the recent high. On the upside, if buyers push the coin above the $22 resistance, the market will rally above $25 high. Though, the bulls are going to face stiff resistance at the recent high. Similarly, if buyers fail to push above the recent resistance, Polkadot will fall.
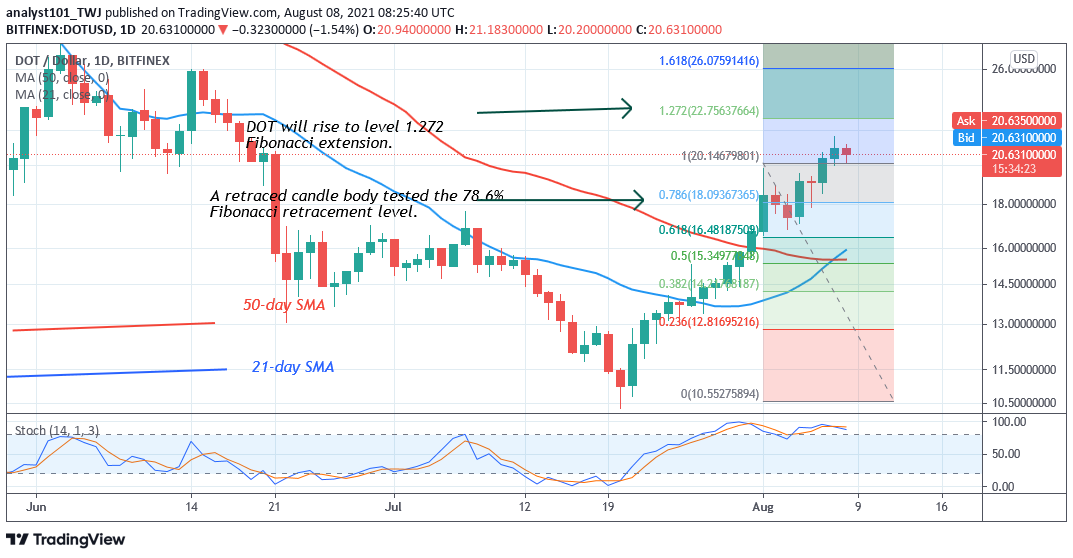
The market will decline to $16 low and resume range-bound move between $16 and $22. Meanwhile, on August 1 uptrend; a retraced candle body tested the 78.6% Fibonacci retracement level. The retracement indicates that the altcoin will rise but reverse at level 1.272 Fibonacci extensions. or level $22.75. From the price action, the altcoin is facing rejection at the $22 high. If the altcoin retraces, it will decline to the 78.6% Fibonacci retracement level where it originated.
LTC /USD Major Trend: Bullish
Litecoin’s (LTC) price has broken the moving averages as the crypto trades in the bullish trend zone. In the first uptrend, LTC/USD rallied to $149 but was repelled as the altcoin fell to $135 low. For the past week, Litecoin has been in a downward correction below the recent high.
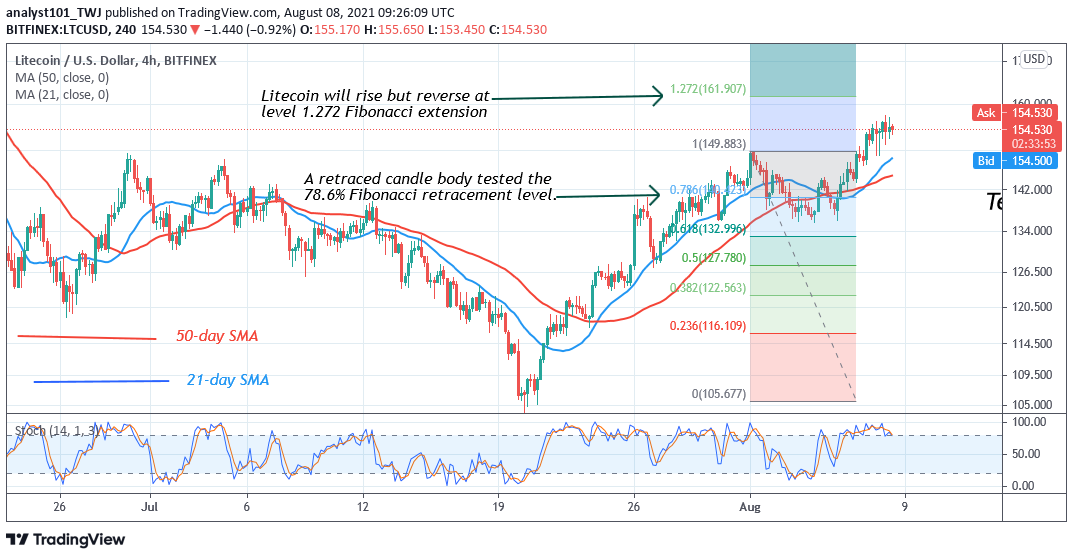
On August 7, the bulls broke the $149 resistance to reach the high of $154. Further upward move is doubtful as Litecoin trades in the overbought region of the market. Since August 5, Litecoin has been trading in the overbought region. Meanwhile, on August 1 uptrend; a retraced candle body tested the 78.6% Fibonacci retracement level. This retracement indicates that the market will rise to level 1.272 Fibonacci extensions or level $161.90.
LINK /USD Major Trend: Bullish
Chainlink’s (LINK) price has broken above the moving averages and resistance line of the descending channel. The crypto will continue to rise as long as the price bars are above the moving averages. Presently, the upward move is stalled below the $24.26 high.
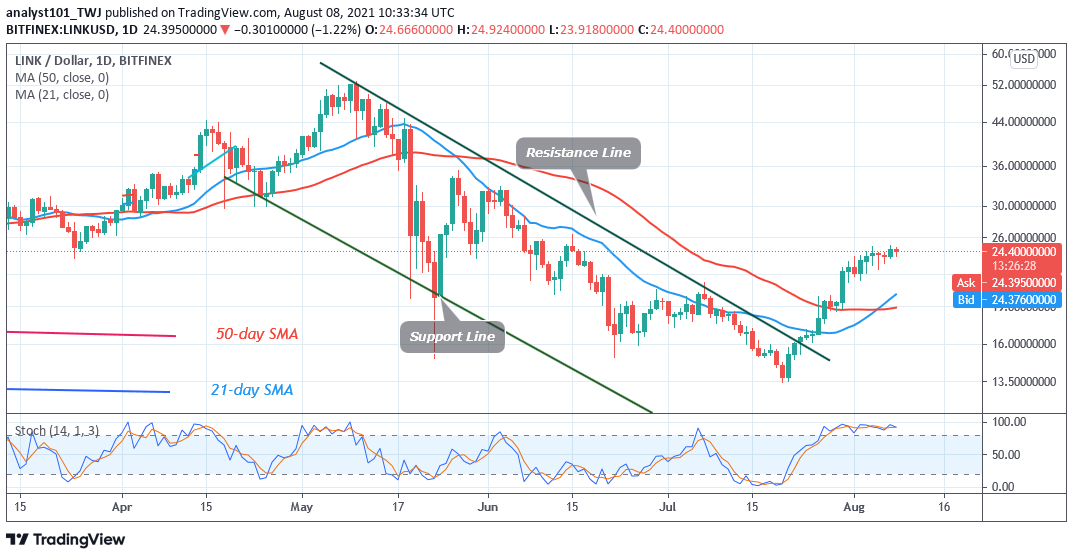
Buyers have been making frantic efforts to break above the recent high. Further upward moves are unlikely as the crypto reaches the overbought region. However, if the bulls push the crypto above the $24 resistance, the market will rally to $30 or $36.Nonetheless, LINK price will continue to fluctuate between $22 and $24 price levels if the recent high remains unbroken.


