
Following the December 4 price collapse, Bitcoin’s (BTC) price has been compelled to a range-bound move between $47,000 and $52,000 price levels. Similarly, Ripple and other altcoins are consolidating at the bottom of the chart after the recent price breakdown. There is a likelihood of trend change as the market reaches an overbought region.
BTC/USD Major Trend: Bearish

Bitcoin’s (BTC) price is below the moving averages and it is facing resistance at the $50,000 price level. . For the past week, BTC/USD has been range-bound between $47,000 and $52,000 price levels. On December 4 price breakdown, BTC price plunged to the low of $41,634 as bulls bought the dips. The upward correction is facing rejection at $50,000 high. On the upside, if buyers breach the initial resistance and BTC price is above the $52,000 high, the uptrend will resume. Buyers will continue the bullish run to the next resistance at $54,000.
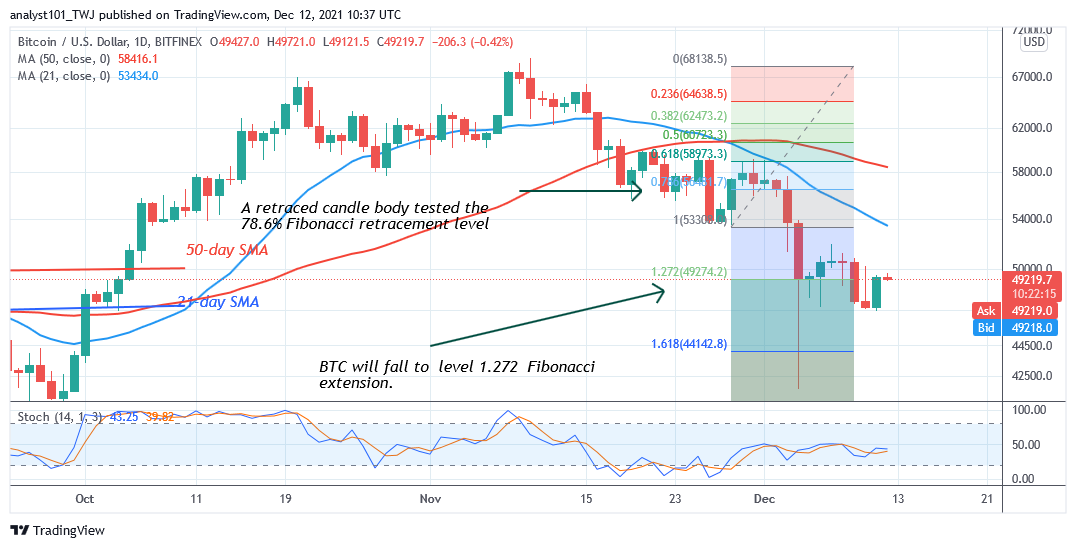
A break above the $54,000 resistance will push the crypto above the $58,000 high. However, if the bullish scenario fails, Bitcoin will be compelled to continue downward correction. On November 28 downtrend; a retraced candle body tested the 78.6% Fibonacci retracement level. The retracement indicates that BTC price will fall but reverse at level 1.272 Fibonacci extension or $49,274.20.
XRP/USD Major Trend: Bearish
Ripple’s (XRP) price is trading in the bearish trend zone. Since December 4 price collapse, XRP has been consolidating above the $0.76 support.
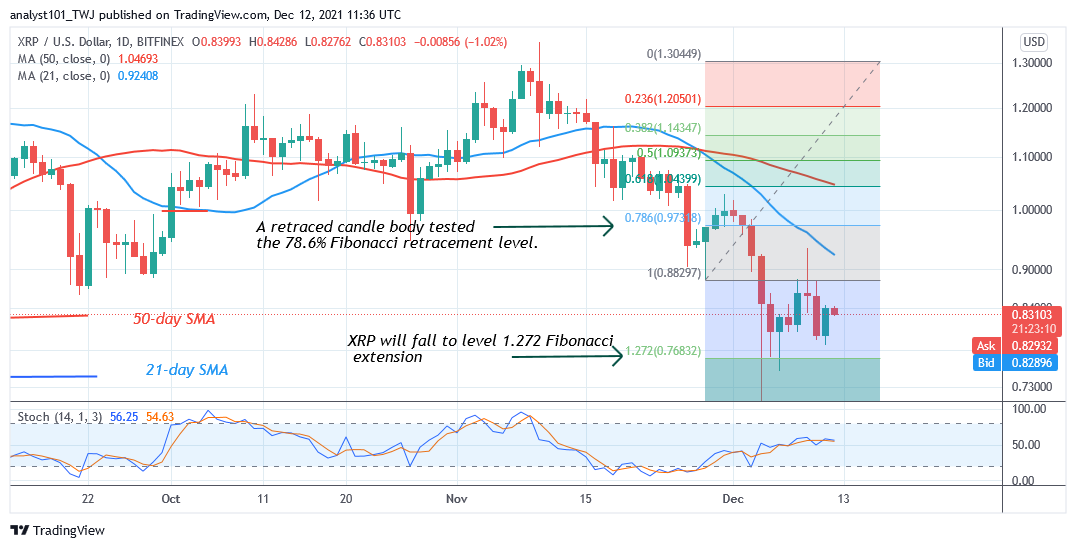
For the past week, XRP is in a range bound move between $0.76 and $0.93. Today, XRP is retracing from the recent high. The upward move has been stalled as prices fail to break above $0.93 resistance. The bears will attempt to revisit the previous low at $0.76. A break below the current support will sink the altcoin to the low of $0.60. Meanwhile, on November 28 downtrend; a retraced candle body tested the 78.6% Fibonacci retracement level. The retracement indicates that XRP price will fall but reverse at level 1.272 Fibonacci extension or $0.768.
DOT/USD Major Trend: Bearish
Polkadot’s (DOT) price has fallen to the oversold region of the market. The current downtrend has reached bearish exhaustion. Buyers are likely to emerge to push prices upward.
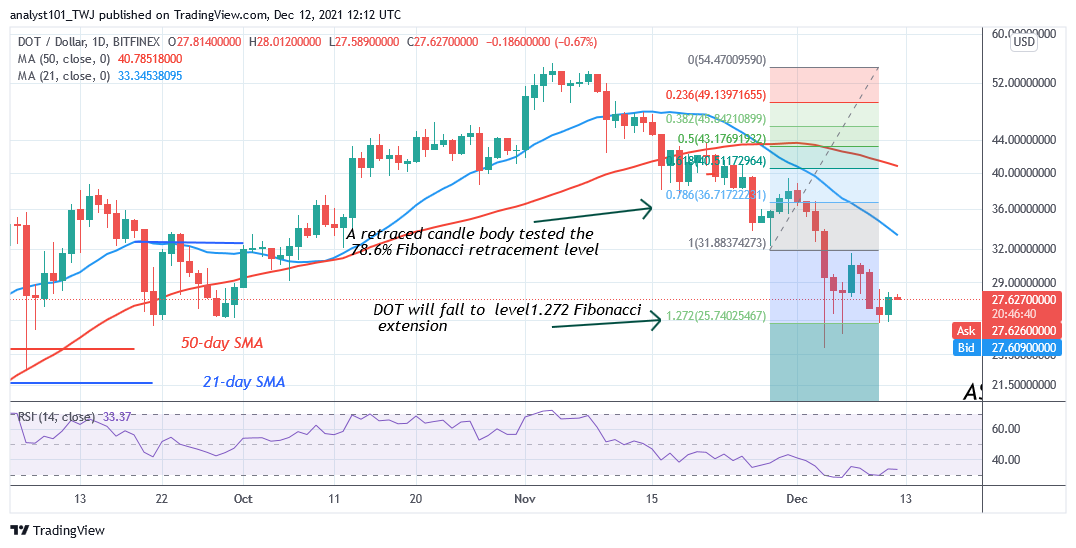
For the past week, the altcoin has been fluctuating between $25 and $32 price levels. Today, the DOT price is retracing to the lower price range. A break below the current support will push the altcoin to the low of $23. The upside momentum will resume if price breaks above the $32 resistance. Meanwhile, on November 28 downtrend; a retraced candle body tested the 78.6% Fibonacci retracement level. The retracement indicates that DOT will fall but reverse at level 1.272 Fibonacci extension or $25.74.
LTC /USD Major Trend: Bearish
Litecoin’s (LTC) price has fallen to the oversold region of the market. This is an indication that the selling pressure has reached bearish exhaustion.
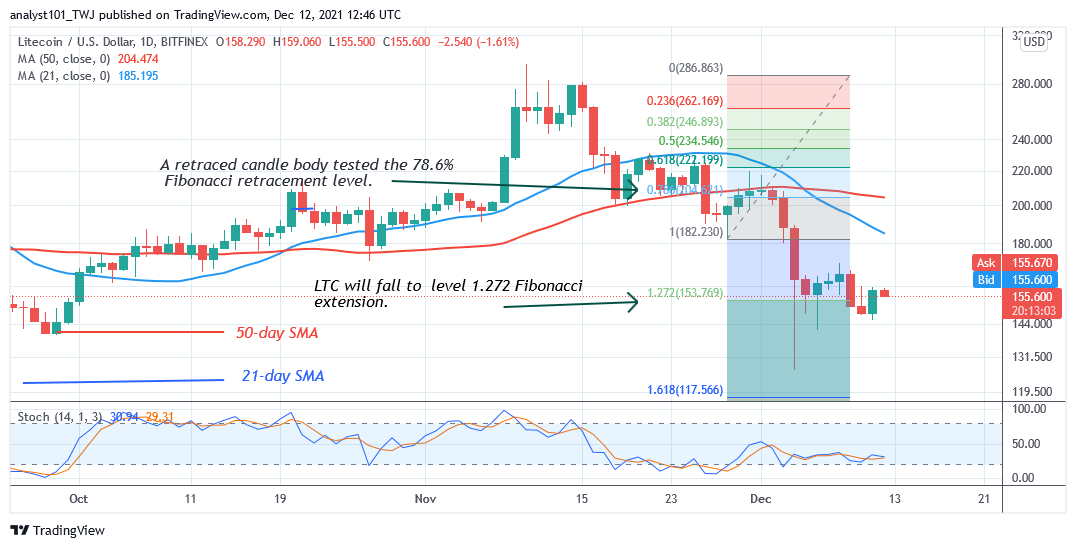
Yesterday, buyers were attempting to push the cryptocurrency to the previous price levels. The upward move is facing resistance at the recent high. Since December 4 price collapse, Litecoin bulls bought the dips as the market resumed fluctuation between $140 and $170 price levels. Meanwhile, on November 28 downtrend; a retraced candle body tested the 78.6% Fibonacci retracement level. The retracement indicates that Litecoin is likely to fall but reverse at level 1.272 Fibonacci extension or $153.76. From the price action, LTC/USD is testing the Fibonacci extension
LINK /USD Major Trend: Bearish
Chainlink’s (LINK) price has fallen to the oversold region of the market. The cryptocurrency consolidates at the bottom of the chart. For the past week, the altcoin has been trading between $18 and $23 price levels.
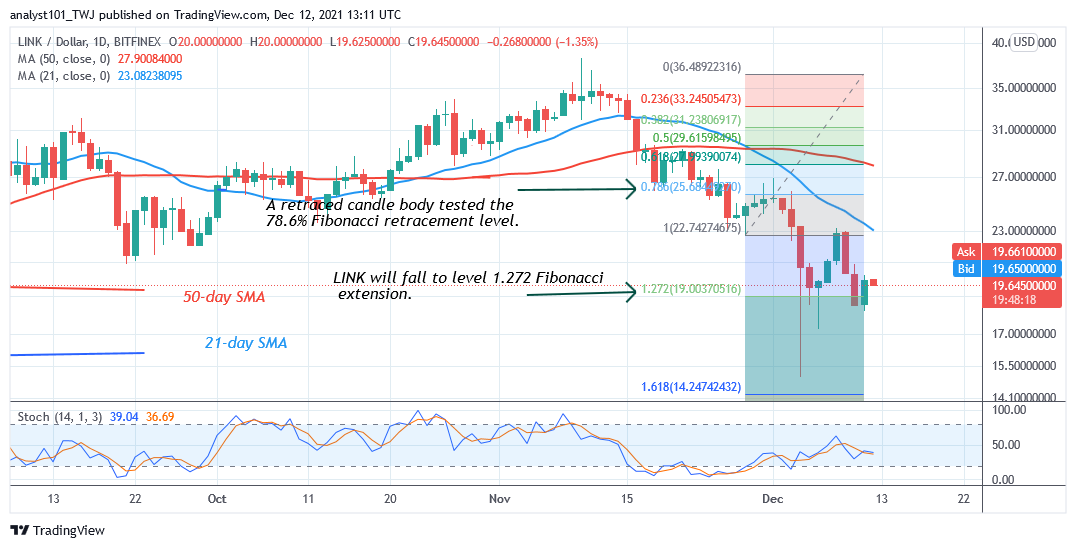
Today, the market is retracing to a lower price level. If the bears break below the `current support, the market will decline to the low of $15. On the upside, a break of the above resistance at $23, LINK price will rally to the next resistance at $27. Meanwhile, on November 28 downtrend; a retraced candle body tested the 78.6% Fibonacci retracement level. The retracement indicates that LINK will fall to level 1.272 Fibonacci extension or $19.00 high. From the price action, the altcoin is testing the Fibonacci extension.


