
Bitcoin’s (BTC) price is consolidating above the $45,500 support but the uptrend has been restricted below the $50,000 psychological price level. A rebound above the current support will push the crypto to the previous high. Ripple and the other altcoins have reached bearish exhaustion. The altcoins are trading in a range amidst bullish expectations.
BTC/USD Major Trend: Bearish
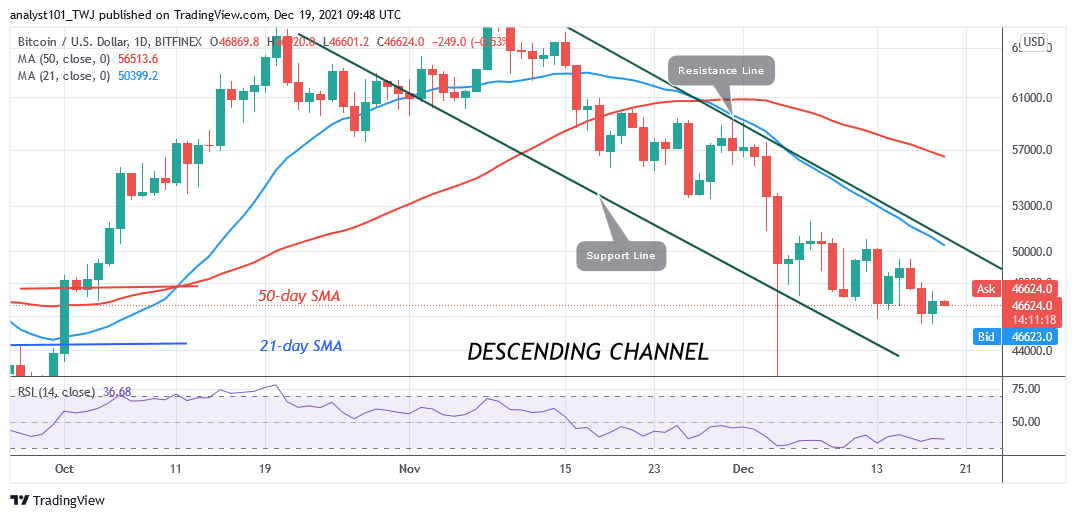
Bitcoin’s (BTC) price is now trading at the bottom of the chart. . After the December 4 price slump, BTC’s price has been fluctuating between $45,500 and $52,000 price levels. For the past two weeks, the range-bound levels have remained intact. Neither the buyers nor the sellers have broken below or above the range-bound levels. For instance, Bitcoin will decline to $41,634 low if the bears have broken below the $45,500 support and the bearish momentum is sustained.
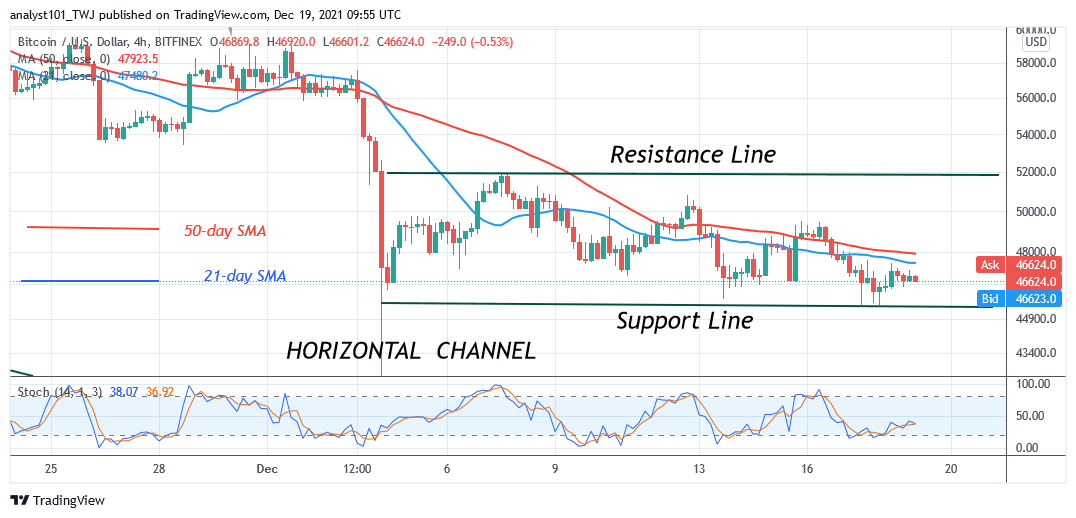
Similarly, BTC price will revisit the $60,000 psychological price levels if the bulls have broken above the $52,000 resistance. The present price action is characterized by small body indecisive candlesticks called Doji and Spinning tops. These candlesticks are responsible for the current range-bound movement. These candlesticks indicate that buyers and sellers are undecided about the direction of the market. Bitcoin is stuck below the $50,000 psychological price level.
XRP/USD Major Trend: Bearish
Ripple’s (XRP) price has been consolidating above the $0.76 support soon after the December 4 price slump. The current support is the August 8 historical price level where the market made an upward move to reach the previous high of $0.30.
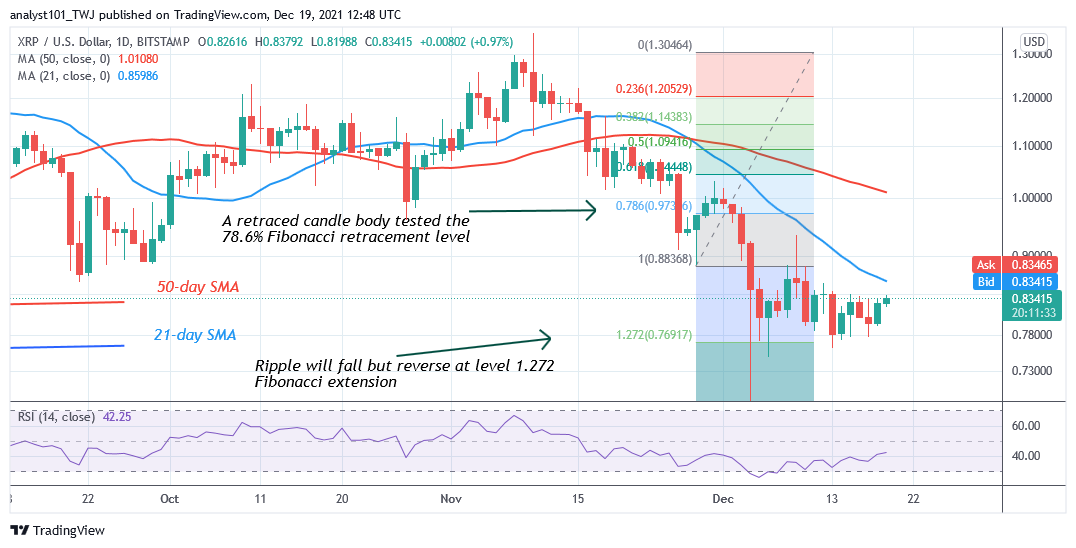
Meanwhile, Ripple has been fluctuating between $0.76 and $0.90 price levels. It will rally to $1.00 and $1.10 highs if buyers break the initial resistance at $0.90. The cryptocurrency will be out of downward correction. Nevertheless, the price indicators have shown a possible reversal of the crypto. On November 28 downtrend; a retraced candle body tested the 78.6% Fibonacci retracement level. The retracement indicates that XRP price will fall but reverse at level 1.272 Fibonacci extension or $0.76.
DOT/USD Major Trend: Bearish
Polkadot’s (DOT) price is trading at the bottom of the chart. After the December 4 price slump, the cryptocurrency has been trading between $24 and $31 price levels.
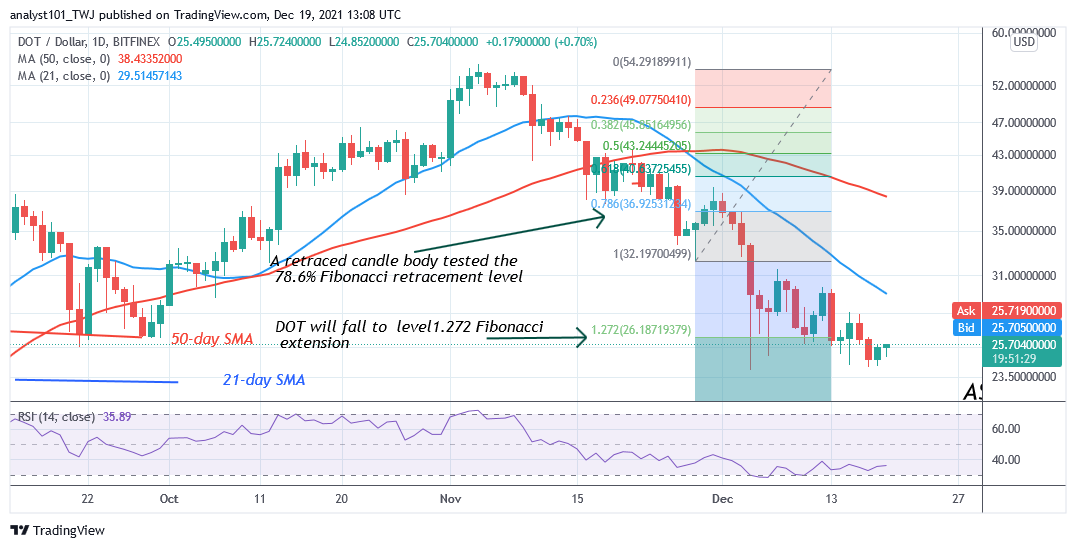
The altcoin has already fallen to the oversold region on December 4. Buyers are expected to emerge in the oversold region to push prices upward. Today, Polkadot is rising to the upside. A strong rebound above the current support will catapult the altcoin out of downward correction. Meanwhile, on November 28 downtrend; a retraced candle body tested the 78.6% Fibonacci retracement level. The retracement indicates that DOT will fall but reverse at level 1.272 Fibonacci extension or $26.18.
LTC /USD Major Trend: Bearish
Litecoin’s (LTC) price is trading at the bottom of the chart. The cryptocurrency is consolidating above the $140 support. After the December 4 price slump, the altcoin has been fluctuating between $140 and $170 price levels.
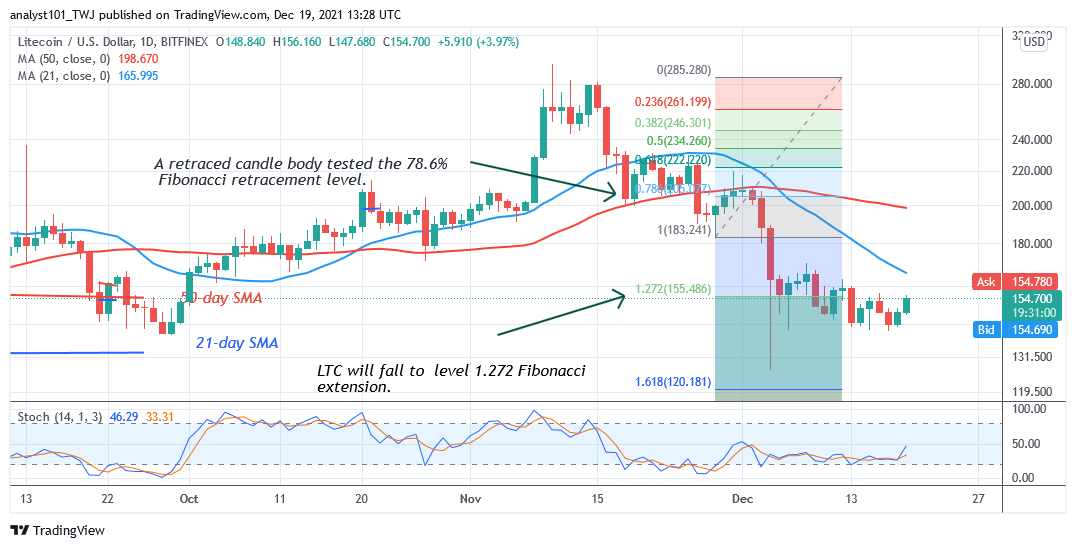
The $140 support is the historical price levels of August and September. In previous price action, the current support was holding as the altcoin resumed the uptrend. Meanwhile, on November 28 downtrend; a retraced candle body tested the 78.6% Fibonacci retracement level. The retracement indicates that Litecoin is likely to fall but reverse at level 1.272 Fibonacci extension or $155.48. From the price action, LTC/USD has resumed uptrend after a rebound
LINK /USD Major Trend: Bearish
Chainlink’s (LINK) price is still in a downward correction. Presently, the cryptocurrency is fluctuating between $17.20 and $23 for the past two weeks.
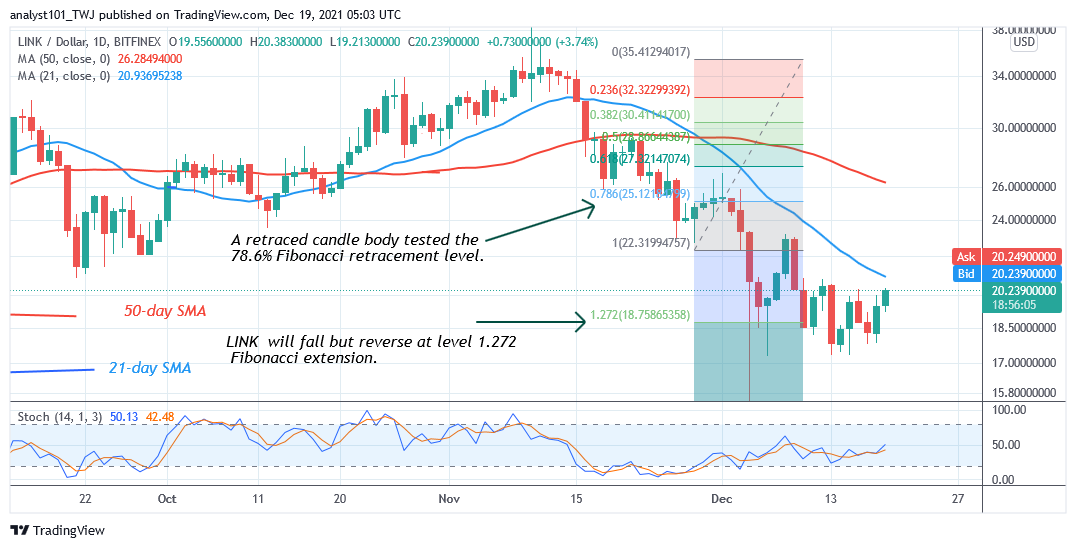
On December 8, buyers pushed the altcoin to the high of $23 but could not sustain the bullish momentum. Nonetheless, if buyers pushed the altcoin above the $26 high, Chainlink will be out of downward correction. Perhaps, it will signal the resumption of the uptrend. In the meantime, LINK’s price is rising and has reached the high of $20 at press time. Meanwhile, on November 28 downtrend; a retraced candle body tested the 78.6% Fibonacci retracement level. The retracement indicates that LINK will fall to level 1.272 Fibonacci extension or $18.75 high.