
Bitcoin and the other altcoins have regained bullish momentum. The cryptocurrencies are still in a downward correction as Bitcoin and the altcoins fail to break above their recent highs. On the daily chart, a fresh uptrend may resume if the cryptos find support above the 21-day line moving average.
BTC/USD Major Trend: Bearish
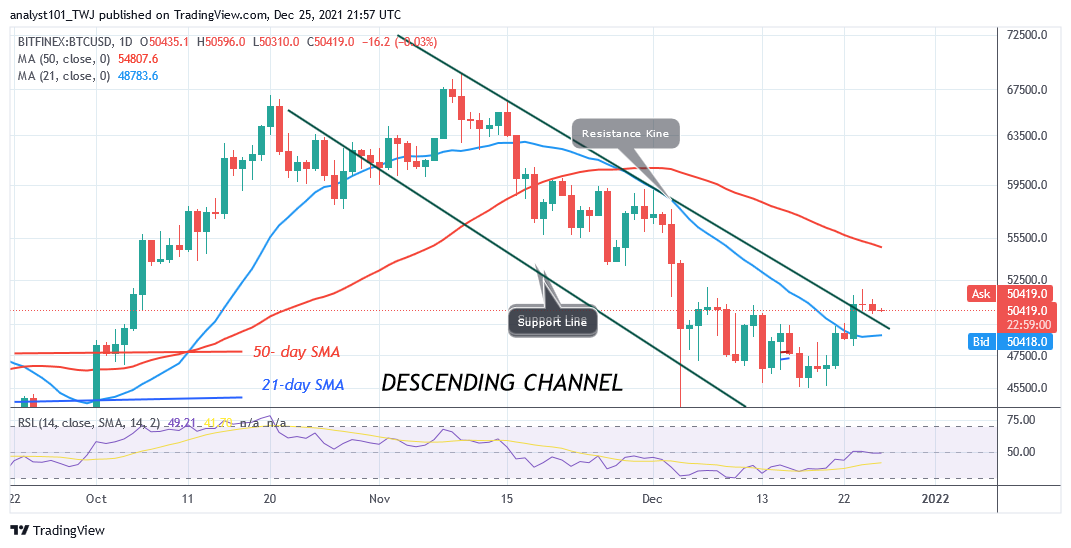
Bitcoin’s (BTC) price has rebounded above $45,500 support as the crypto reached the high of $51,413. BTC’s price reached the overbought region of the market. It is presently fluctuating below the recent high. On the upside, if the current bullish momentum is sustained and price breaks above the 50-day line moving average, the upward move will be accelerated. BTC price will rise to the high of $54,000. Nonetheless, a break above the $54,000 will signal the resumption of upside momentum.
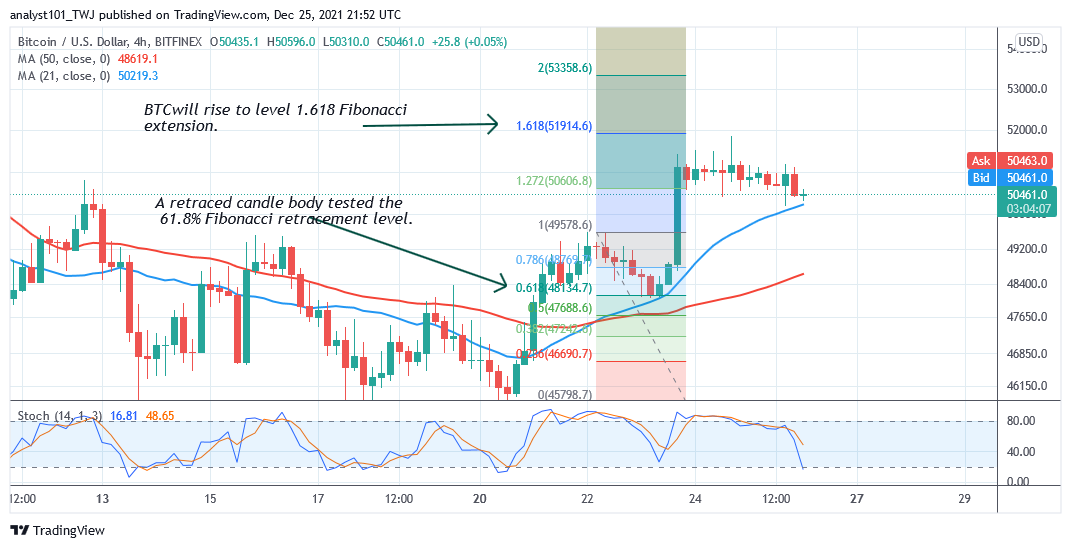
Conversely, if the BTC price faces rejection at the 50-day line moving average, the cryptocurrency will be compelled to a range-bound move. Meanwhile, on December 22 uptrend; a retraced candle body tested the 61.8% Fibonacci retracement level. The retracement indicates that Bitcoin is likely to rise to level 1.618 Fibonacci extension or $51,914.60. From the price action, BTC price is declining as the market reaches the overbought region.
XRP/USD Major Trend: Bearish
For the past week, Ripple’s (XRP) price has been making positive moves as the altcoin reached the high of $1.00. The $1.00 high was an overbought region. Sellers push XRP to the low of $0.89 to resume a fresh uptrend.
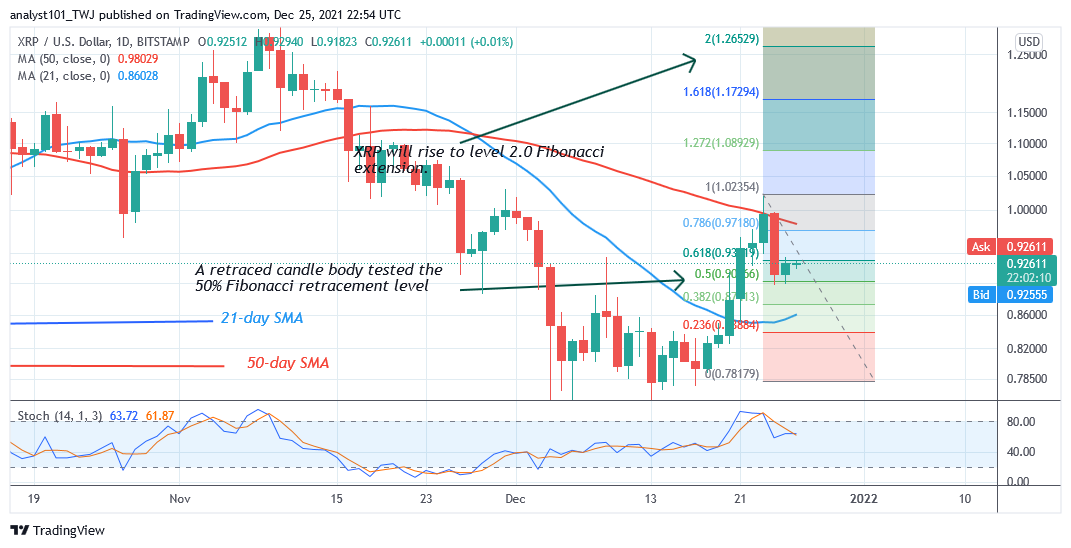
Buyers have broken above the 21-day line moving average and it is approaching the 50-day line moving average. A break above the 50-day line moving average will accelerate the uptrend. Conversely, if XRP is repelled at the 50-day line moving average, the altcoin will fall and become range-bound between the two moving averages. In the meantime, the bulls are struggling to break above the 50-day line moving average. On December 23 uptrend; a retraced candle body tested the 50% Fibonacci retracement level. The retracement indicates that XRP price will rise to level 2.0 Fibonacci extension or $1.26.
DOT/USD Major Trend: Bearish
Polkadot’s (DOT) price rebounded above the previous low at $23.50 to reach a high of $29. Since December 23, buyers could not keep prices above the recent high. DOT price is now consolidating below the $29 high. Presently, the rebound has propelled the altcoin to break above the 21-day line moving average.
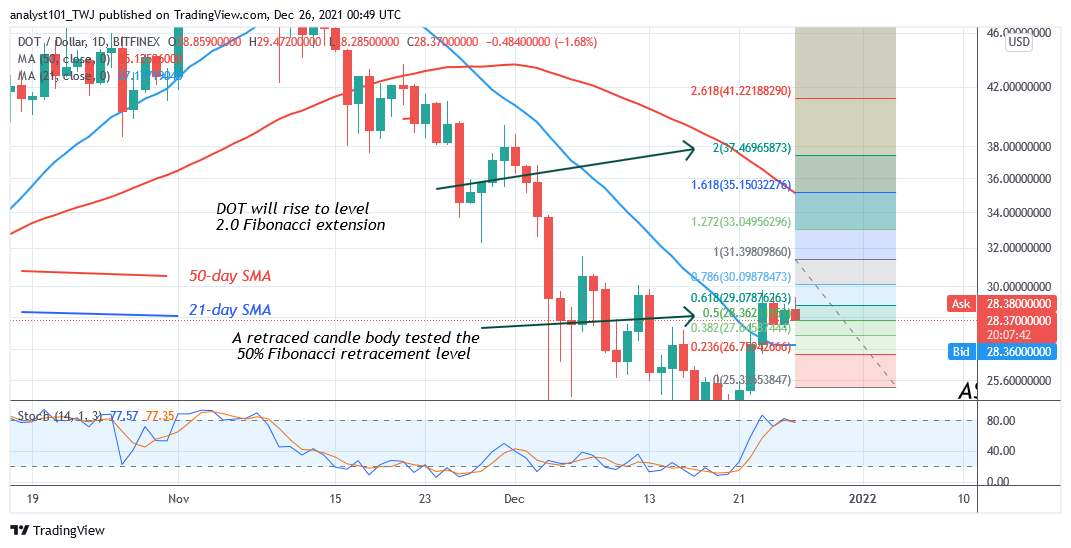
Polkadot will resume upside momentum if buyers push the altcoin above the 50-day line moving average. In other words, buyers will have to keep the price above the $40 high. The bullish momentum will extend to the previous high of $38. On December 23 uptrend; a retraced candle body tested the 50% Fibonacci retracement level. The retracement indicates that DOT price will rise to level 2.0 Fibonacci extension or $37.46.
LTC /USD Major Trend: Bearish
Litecoin’s (LTC) price has remained in downward correction but faces rejection at the $165 high. Today, the cryptocurrency is retracing after breaking above the 21-day line moving average.
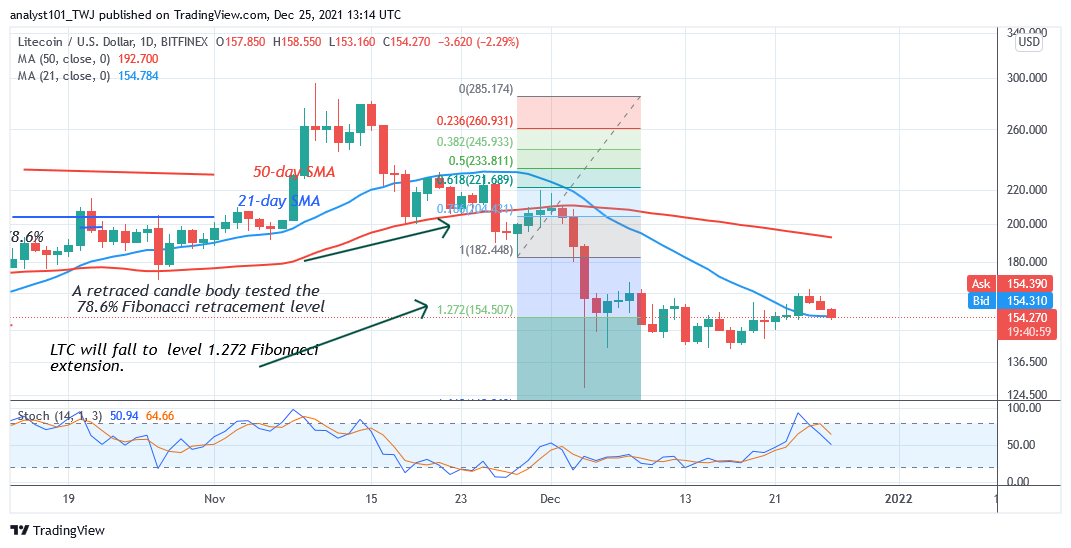
The altcoin is falling to the range-bound zone between $140 and $165. On the downside, if the bears break below the $140 support, the market will decline to $126 low. On the upside, if buyers clear the resistance at $165 and $200, the uptrend will resume. The altcoin will be out of downward correction if it breaks above the $200 high. Meanwhile, on November 28 downtrend; a retraced candle body tested the 78.6% Fibonacci retracement level. The retracement indicates that LTC price will fall to level 1.272 Fibonacci extensions or $154.50.
LINK /USD Major Trend: Bearish
Chainlink’s (LINK) price is still in a downward correction. The cryptocurrency has been making positive moves as it reaches the high $22. The altcoin has retraced to the low of $21 for a possible upward move.
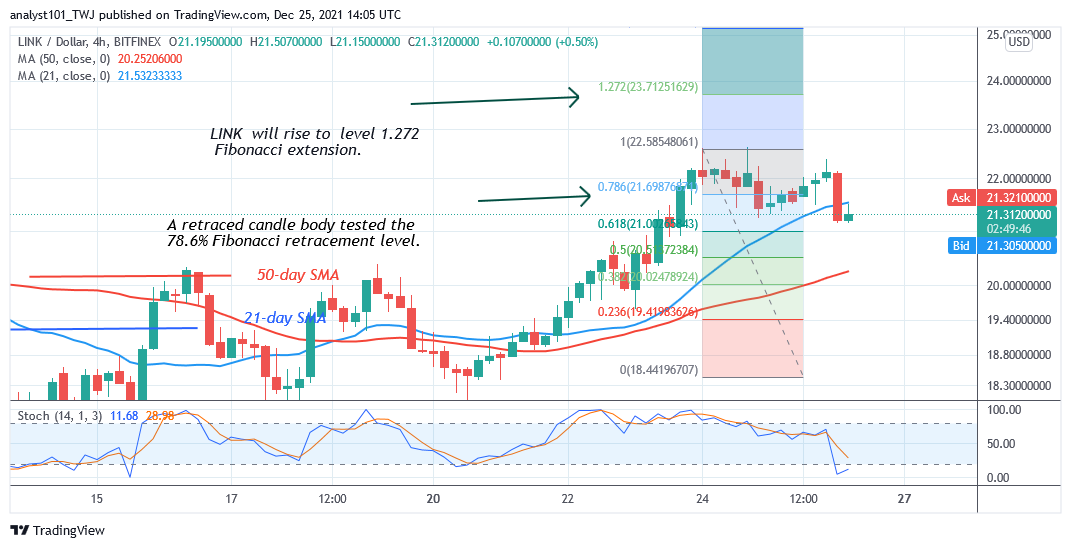
On the upside, if buyers keep LINK price above $26, Chainlink will be out of downward correction. The bullish momentum will extend to the highs of $30 and $34. Presently, Chainlink is fluctuating below the $22 high. Meanwhile, on December 24 uptrend; a retraced candle body tested the 78.6% Fibonacci retracement level. The retracement indicates that LINK will rise to level 1.272 Fibonacci extension or $23.71 high. From the price action, the DOT price is fluctuating below the $22 high.


