
Bitcoin (BTC) plunges to $41,000 low as the crypto loses the $56,000 support. On December 4, BTC/USD was confined to a narrow range between $56,000 and $57,000 as bears broke the crucial support. Bitcoin is in a deeper downward correction. Nonetheless, the December 4, price spike also affected the underlisted cryptocurrencies. The cryptos have plunged to their oversold regions of the market. After a downward correction, there is likely to be an upward movement of prices.
BTC/USD Major Trend: Bearish
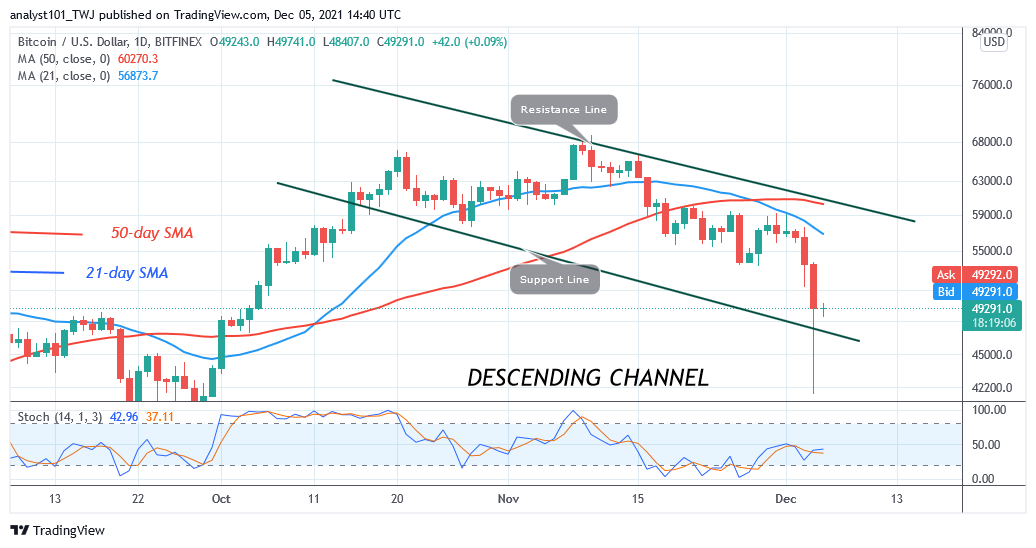
On December 4, Bitcoin’s (BTC) price crashed from $59,174 high to a low of $41,634 as bulls bought the dips. This sudden crash resulted from price consolidation between $56,000 and $57,000. BTC price was earlier in a range-bound move between $56,000 and $59,000 since November 29. However, in the last 48 hours, the price consolidation was narrowed to $56,000 and $57,000. This tight consolidation resulted in the bears breaking the $56,000 support. The bears have broken below the $56,000 support to reach the low of $41,000.
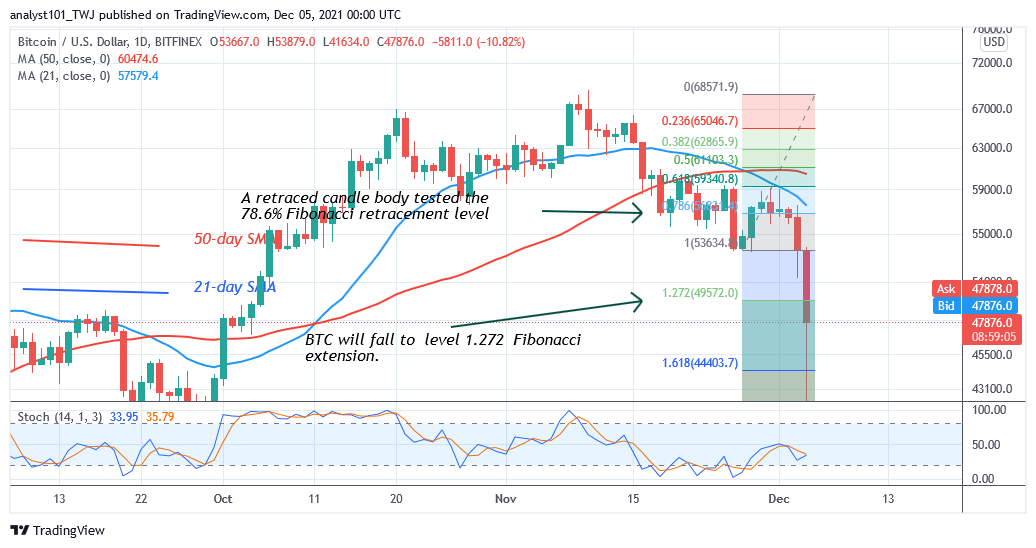
On the other hand, the bulls have bought the dips as BTC price made an upward correction. Following the recent breakdown, Bitcoin has been correcting upward as price reached the high of $49,033. On the upside, if buyers break above the moving averages or $58,000 high, Bitcoin will resume upside momentum. If buyers fail to clear the $58,000 resistance, Bitcoin will continue to be in a downward correction for a few days
.XRP/USD Major Trend: Bearish
Ripple’s (XRP) price has been in a downward move as price broke below the moving average. On December 4, Ripple fell massively to the low of $0.57 as bulls bought the dips. Today, XRP has corrected upward to $0.83. XRP/USD plunged to the oversold region of the market.
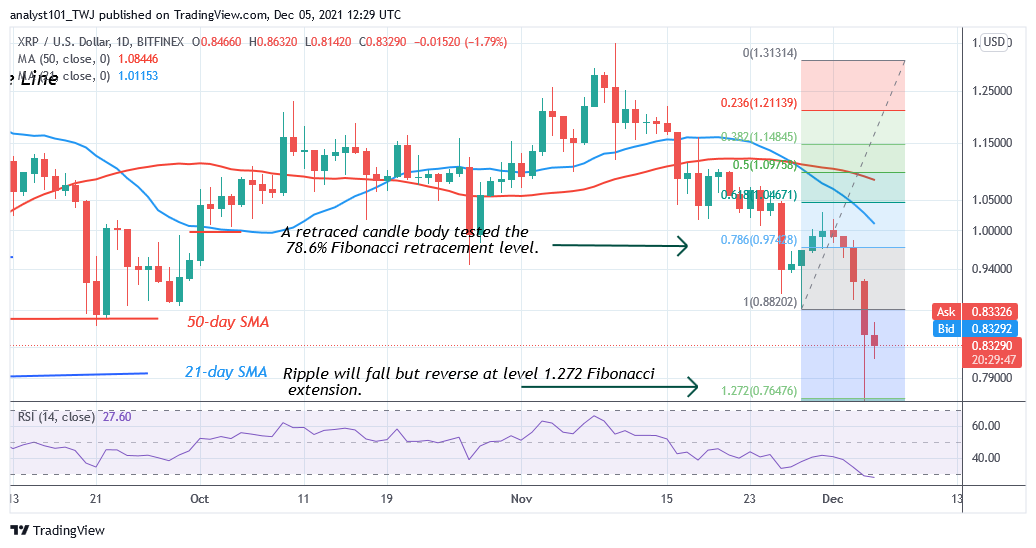
The Relative Strength Index is at level 27 for period 14. Further selling pressure is unlikely as buyers recoup in the oversold region. The RSI has indicated that XRP has no room for further decline. Meanwhile, on November 28 downtrend; a retraced candle body tested the 78.6% Fibonacci retracement level. The retracement indicates that Ripple is likely to fall but reverse at level 1.272 Fibonacci extension or $0.76. From the price action, XRP price is falling and approaching the Fibonacci extension.
DOT/USD Major Trend: Bearish
Polkadot’s (DOT) price is in a downward move and has reached the oversold region of the market. DOT price fell to the low of $23.95 as bulls bought the dip.
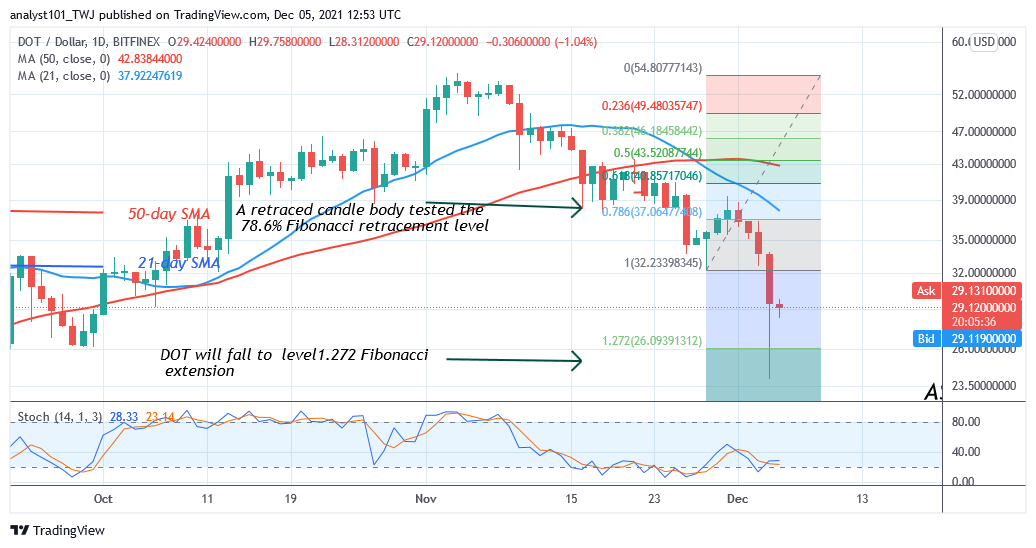
The long candlestick tail is pointing to the $23 low indicating that the current support is a strong buying pressure. The current downtrend has reached bearish exhaustion. Meanwhile, on November 28 downtrend; a retraced candle body tested the 78.6% Fibonacci retracement level. The retracement indicates that Polkadot is likely to fall but reverse at level 1.272 Fibonacci extension or $26.09
LTC /USD Major Trend: Bearish
Litecoin’s (LTC) price is in a downward move as price plunged to $126 low and pulled back. Litecoin is trading at $159.33 at the time of writing.
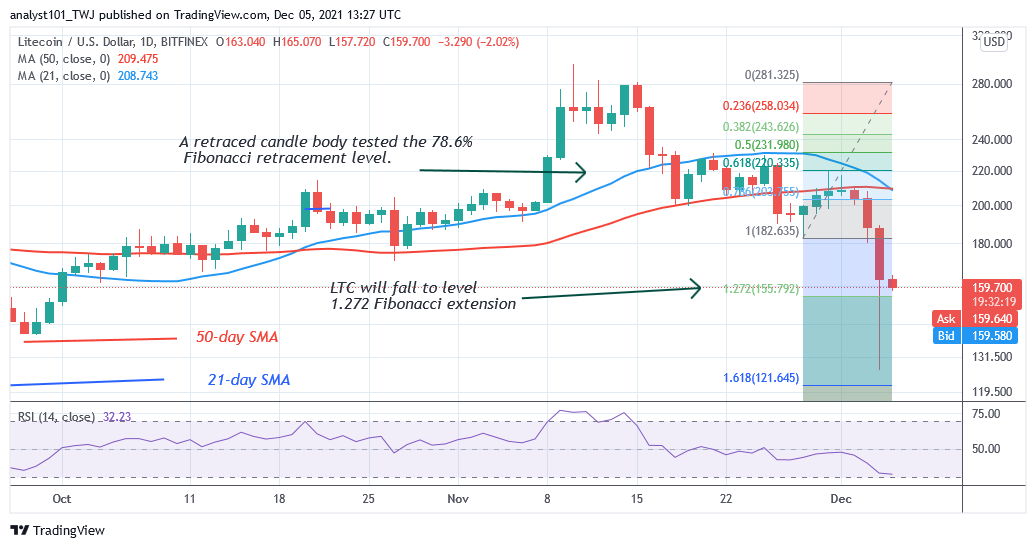
The cryptocurrency is likely to further decline as it approaches the oversold region of the market. The altcoin is likely to revisit the previous low of $140. Meanwhile, on November 28 downtrend; a retraced candle body tested the 78.6% Fibonacci retracement level. The retracement indicates that Litecoin is likely to fall but reverse at level 1.272 Fibonacci extension or $155.79. From the price action, LTC/USD is approaching the
Fibonacci extension
LINK /USD Major Trend: Bearish
Chainlink’s (LINK) price has plunged to the oversold region of the market. It is at level 25 of the Relative Strength Index for period 14. The current downtrend has reached bearish exhaustion.
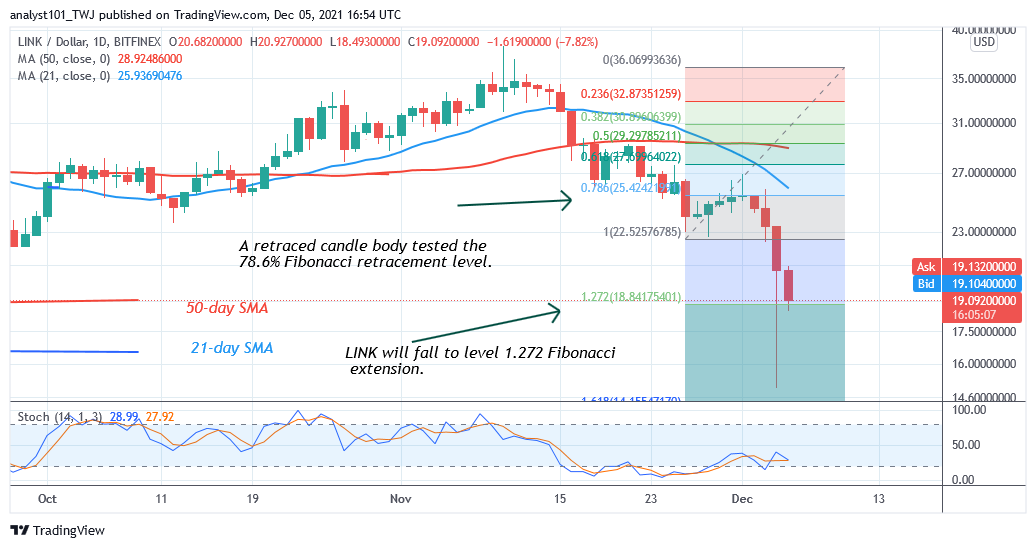
The selling pressure is likely to end. LINK price has earlier plunged to the low of $15 and pulled back. Today, it is trading at $19.97 at the time of writing. Meanwhile, on November 26 downtrend; a retraced candle body tested the 78.6% Fibonacci retracement level. The retracement indicates that LINK will fall but reverse at level 1.272 Fibonacci extensions or $18.84.