

Bitcoin bulls have reclaimed the $40,000 psychological price but the uptrend is stuck below the $48,000 high. This week the Bitcoin is likely to attain the next psychological price level of $50,000. Ethereum and the other altcoin are likely to attain new price levels this week when the resistance levels are breached.
BTC/USD Major Trend: Bullish
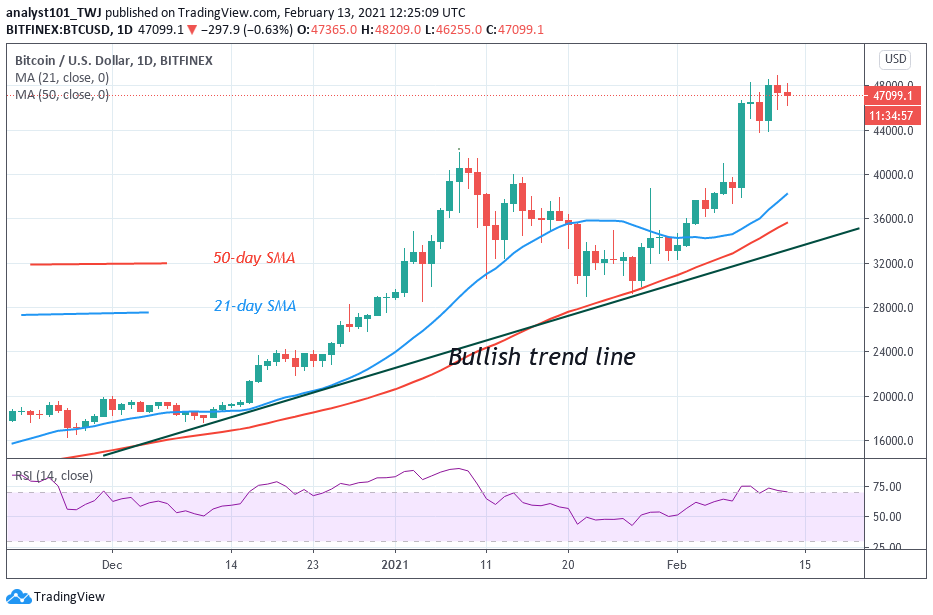
For the past week, the psychological price level of $40,500 was breached. BTC price rallied on the upside as Bitcoin reached the high of $48,000. Unfortunately, the BTC price is stuck below the $48,000 resistance since February 9. For the past five days, the crypto currency has been in a downward correction. The bulls have not been able to penetrate the $48,000 resistance. In the same vein, the bears are yet to break the $44,000 support. In other words, Bitcoin is fluctuating between $44,000 and $48,000.
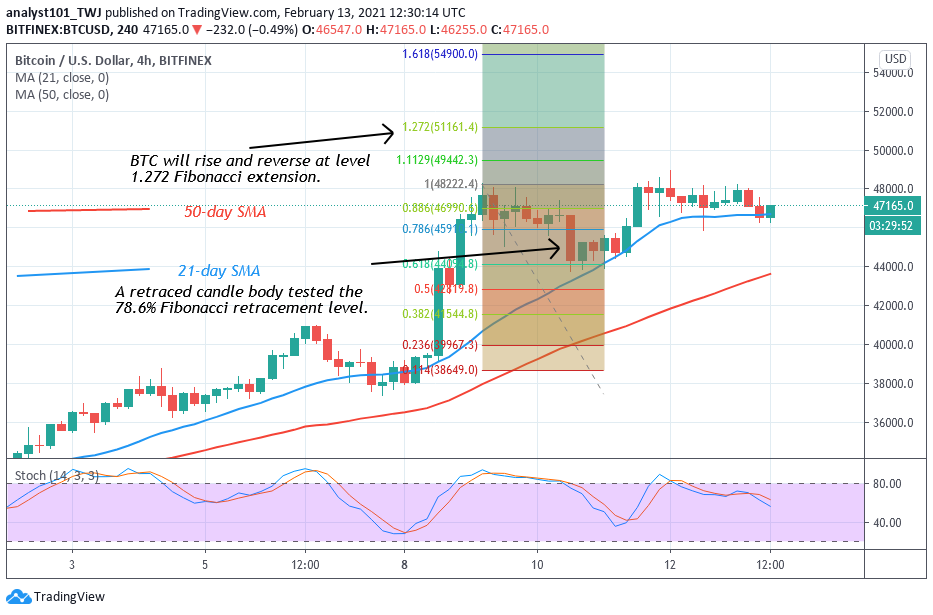
In the coming days, the king coin is likely to attain the next psychological price level of $50,000. The Fibonacci tool indicated an upward movement of the coin. On February 9 uptrend; a retraced candle body tested the 78.6% Fibonacci retracement level. The retracement indicates that BTC price will rise to level 1.272 Fibonacci extensions or the high of $51,161.40. Bitcoin is likely to retrace after attaining the new price level. However, the reversal will not be immediate.
ETH/USD Major Trend: Bullish
Ethereum has been trading marginally in the previous week. The biggest altcoin reached a new high of $1,760 but the bulls could not sustain the uptrend. Ether fell and resumed fluctuation between $1,600 and $1,760. On February 8, the bulls broke the previous peak price to attain a high of $1,825. Today, Ether has risen to $1,874 but the altcoin is retracing after rejection from the recent high. On the upside, if the bulls break the current resistance at $1874, the price will rally above $2,000. If the bulls sustain the bullish momentum, the market will attain another high of $2,500.
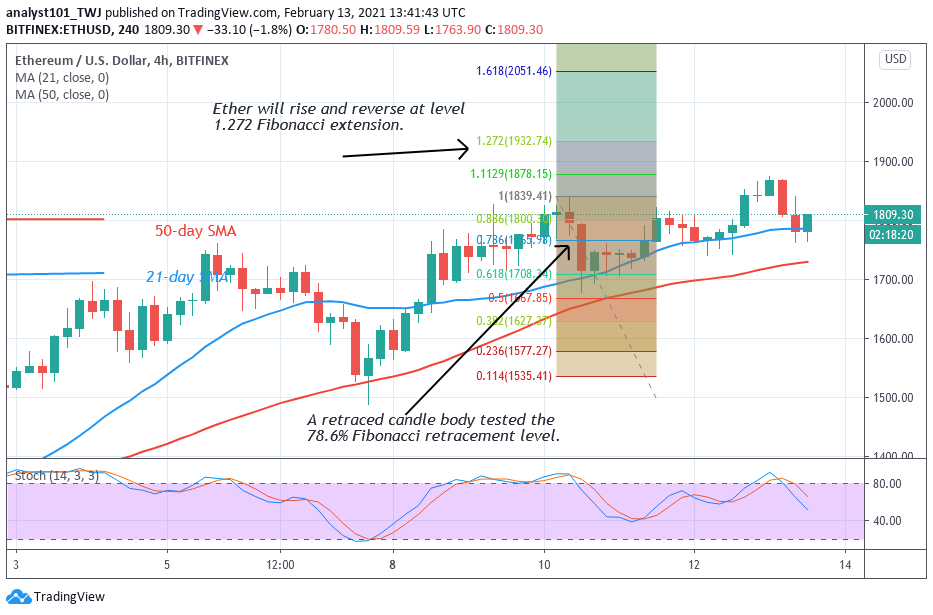
On the downside, if the price retraces and finds support above $1,700, the upward move will resume. The downtrend will resume if the bears break the $1,700 support. Meanwhile, the Fibonacci tool has indicated an upward of the coin. On February 10 uptrend; a retraced candle body tested the 78.6% Fibonacci retracement level. This retracement implies that ETH will rise to level 1.272 Fibonacci extension or the high of $1,932.74. At the recent high of $1,932.74, the market will reverse and returned to the 78.6 % Fibonacci retracement level where it originated.
XRP /USD Major Trend: Bullish
Ripple has been in a smooth uptrend in the previous week. XRP price was making a series of higher highs and higher lows as the price reached the high of $0.54. XRP pulled back because of the selling pressure above the $0.50 resistance. The bulls broke the resistance at $0.54 as the price rallied to a $0.64 high. However, the current uptrend could not be sustained above the $0.64 high. Ripple slumped to $0.542 low but made a pullback. On the upside, if the bulls succeed in pushing the price above $0.65 resistance, the market will resume an upward move.

Possibly, the coin will face a minor resistance at the $0.75 high. Subsequently, the bullish momentum will continue above the $1 high if the minor resistance is cleared. However, if the bulls fail to overcome the initial resistance at $0.65, XRP will be compelled to a range-bound movement between $0.50 and $0.65. The Fibonacci tool has indicated an upward movement of the coin. On February 13 uptrend; a retraced candle body tested the 61.8% Fibonacci retracement level. The retracement implies that Ripple will rise to level 1.618 Fibonacci extension or $0.745 high. The price action is likely to continue above Fibonacci tool analysis.
BCH /USD Major Trend: Bullish
Last week, Bitcoin Cash commenced the resumption of an upward move as the bulls broke the $440 and $480 resistance. However, the price got stuck at the $540 resistance as the bulls failed to break the resistance level. Today, the price has broken the $540 resistance as it rallied on the upside. The altcoin has received price acceleration after the breakout. BCH is trading at $642 at the time of writing. The bulls are attempting to break the overhead resistance at $654 high.
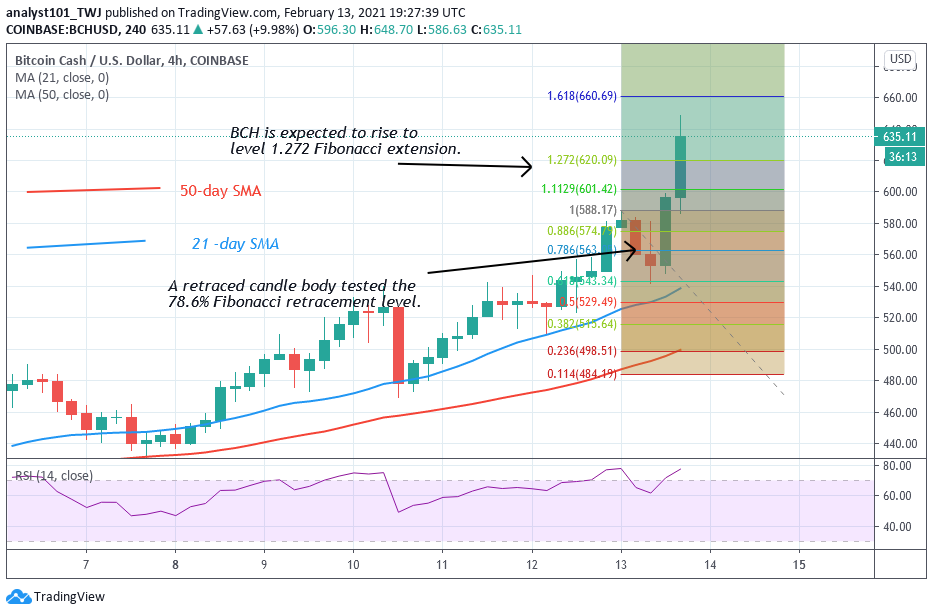
From the price action, Bitcoin Cash has broken the overhead resistance at the time of writing. This week, the bullish momentum will extend above the $745 price level. Nevertheless, the price action has surpassed the Fibonacci tool analysis. That is, on February 13 uptrend; the retraced candle body tested the 78.6% Fibonacci retracement level. The retracement indicates that BCH will reach level 1.272 Fibonacci extensions. In other words, BCH will reach the high of level $620.09 but will reverse. In the meantime, the price action has surpassed this level.


