

Bitcoin bulls broke the $50,000 psychological price level on February 17. Analysts believe that once that level is breached, a rally to $60,000 will be much easier.
Today, the BTC price is trading at $56,136.0 at the time of writing. The biggest altcoin, Ethereum has broken above the $2,000 psychological price level. The breakout was not convincing as price slumped below the $2,000 support. Ripple and Bitcoin Cash are sustaining their recent rallies.
BTC/USD Major Trend: Bullish
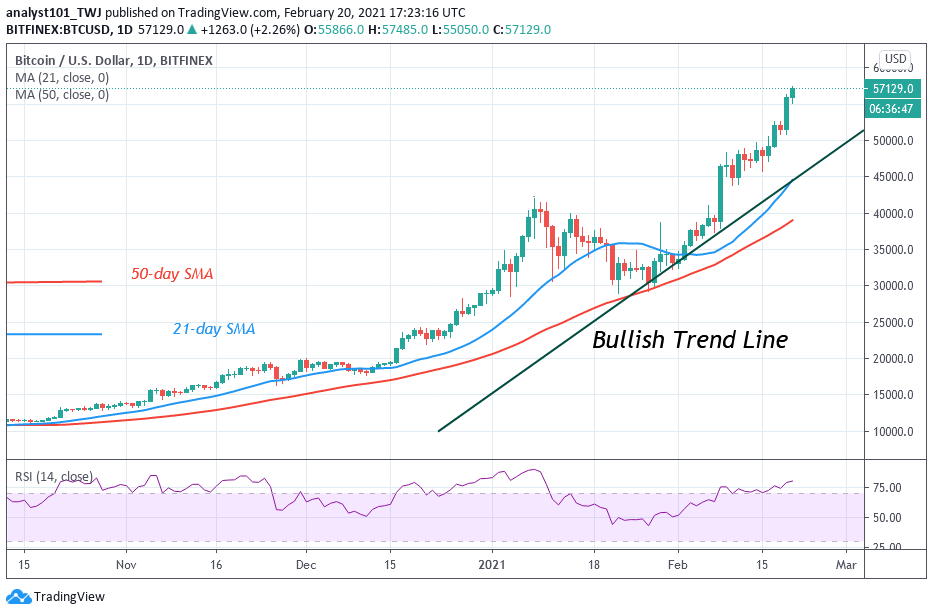
BTC/USD is trading at $55,850 at the time of writing. Meanwhile, in the previous week, Bitcoin bulls struggled to break the $48,000 resistance. It took buyers more than a week to break the resistance level. When it was broken, the price rallied to the $50,000 resistance before it pulled back to $48,000 support. The bullish momentum resumed above the $48,000 support as price broke the $50,000 psychological price level on February 17. After the breakout, the uptrend was stalled at the $52,000 high. Buyers struggled for three days before breaking the recent resistance to reach another high of $55,850. Analysts believe that once the $50,000 resistance has been broken, the rally to $60,000 will be much easy. However, the price indicators have shown that the coin has reached the overbought region of the market. This creates the tendency for prices to fall. Nonetheless, in a trending market, the overbought condition may not hold.
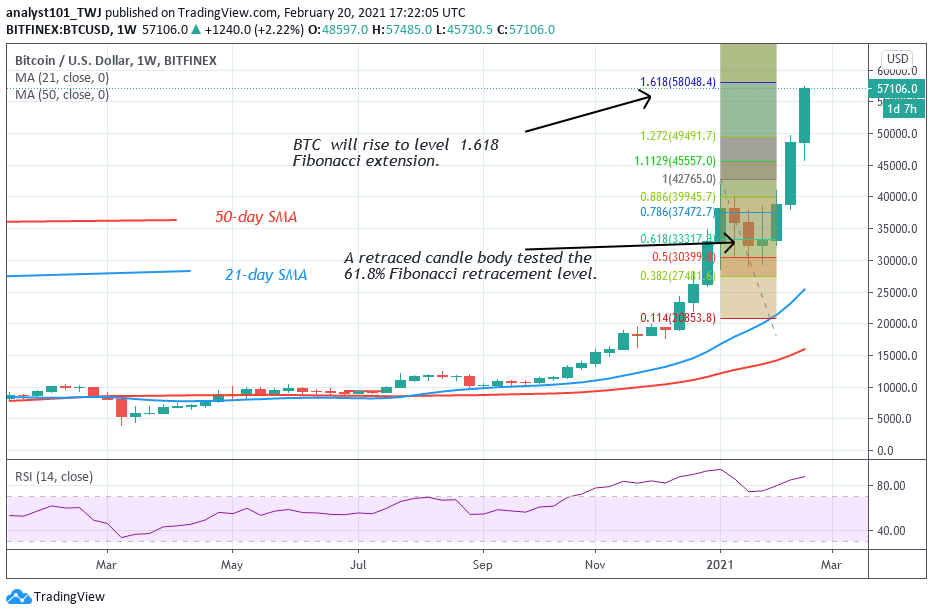
This week the Fibonacci tool has indicated a further upward movement of the coin. On a weekly chart, a retraced candle body on January 18, tested the 61.8% Fibonacci retracement level. The retracement indicates that BTC price will rise to level 1.618 Fibonacci extension or the high of $58,048.40. The market is currently facing some resistance at $56,000 high. If this level is crossed, the BTC price will hit $60,000.
ETH/USD Major Trend: Bullish
Ethereum has attained $2,000 psychological price level at the time of writing. The price broke the resistance at $1,950 as Ether rallied above $2,000. In the previous week, Ether corrected for five days before breaking the resistance at $1,825. This enables buyers to push the price to $1,950 before attaining a new high above $2,000. As bulls broke the $2,000 resistance, the market is expected to rally to $2,500 high.
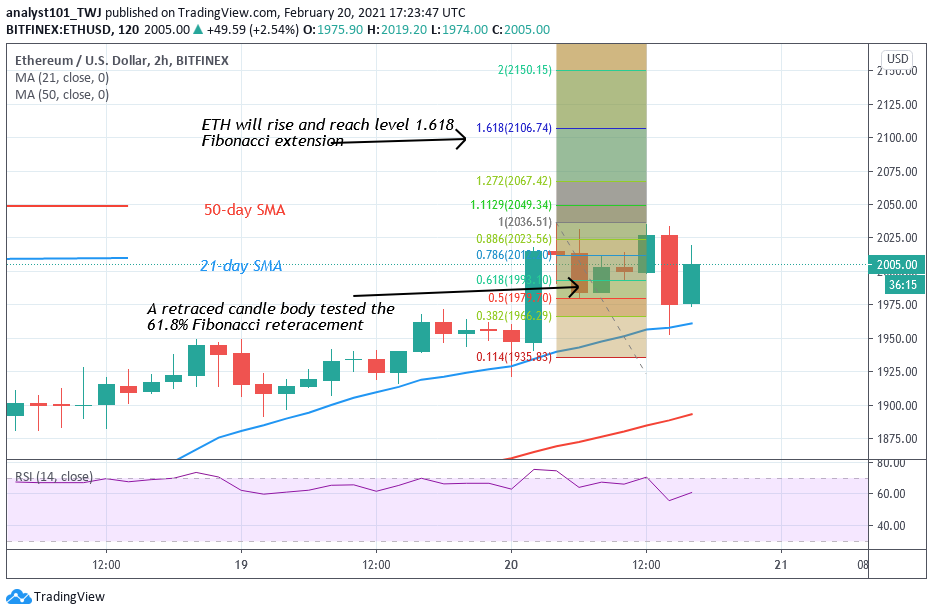
Nonetheless, the RSI has indicated that Ether’s price has reached the overbought region of the market. It is doubtful if the upside momentum will continue or subside. Nevertheless, On February 20 uptrend; a retraced candle body tested the 61.8% Fibonacci retracement level. This retracement implies that ETH will rise to level 1.618 Fibonacci extension or the high of $2,106.74.
XRP /USD Major Trend: Bullish
In the previous week, Ripple rallied to $0.65 high. The upward move could not continue as price reached the overbought region. Consequently, Ripple has been in a downward movement since February 13. The crypto currency fell to the $0.50 support and resumed upward. Today, the upward move is facing resistance as price drops to $0.56. If buyers push the price above the resistance at $56; XRP will rise to retest or break the $0.65 overhead resistance. On the upside, if the bulls overcome the overhead resistance the price will rally to $0.78 high.
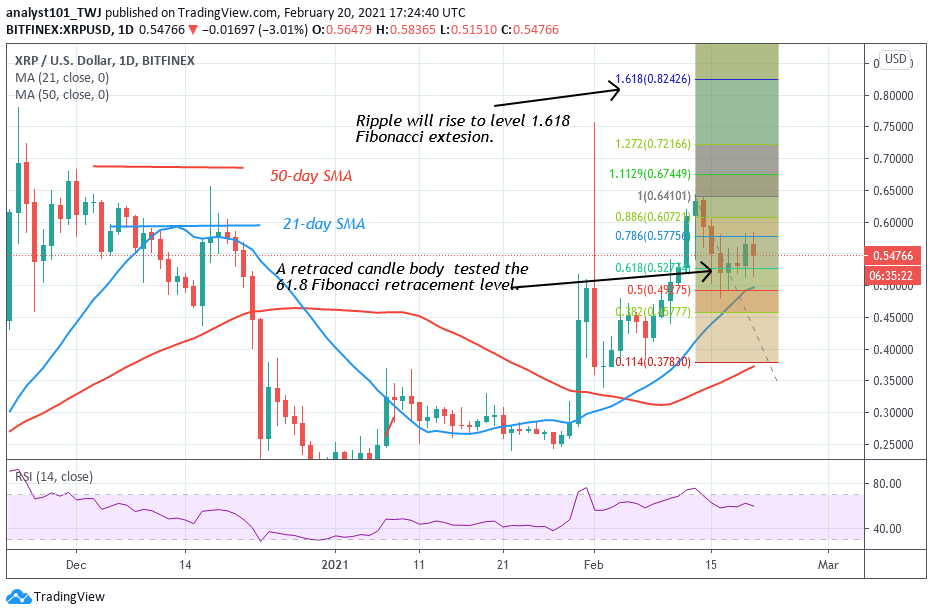
Conversely, if XRP declines and the bears break the $0.50 support, the market will decline to $0.38 low. The bottom line is that where the two levels fail to break, the crypto will be range-bound between $0.50 and $0.65 price levels. XRP/USD is trading at $0.57 at the time of writing. According to the Fibonacci tool, Ripple is likely to move up. On February 13 uptrend; a retraced candle body tested the 61.8% Fibonacci retracement level. The retracement implies that Ripple will rise to level 1.618 Fibonacci extension or $0.82 high.
BCH /USD Major Trend: Bullish
In the previous week, Bitcoin Cash has been in an upward move. In the first uptrend, the market reached a high of $754. In the subsequent upward move, BCH reached the high of $773 but was repelled. The price fell to the low of $676 and resumed a range-bound movement. Since February 15, BCH’s price is fluctuating between $650 and $750. The price action is characterized by small body indecisive candlesticks. On the upside, if buyers can push price above the $750 resistance, a retest at the $773 overhead resistance is likely.
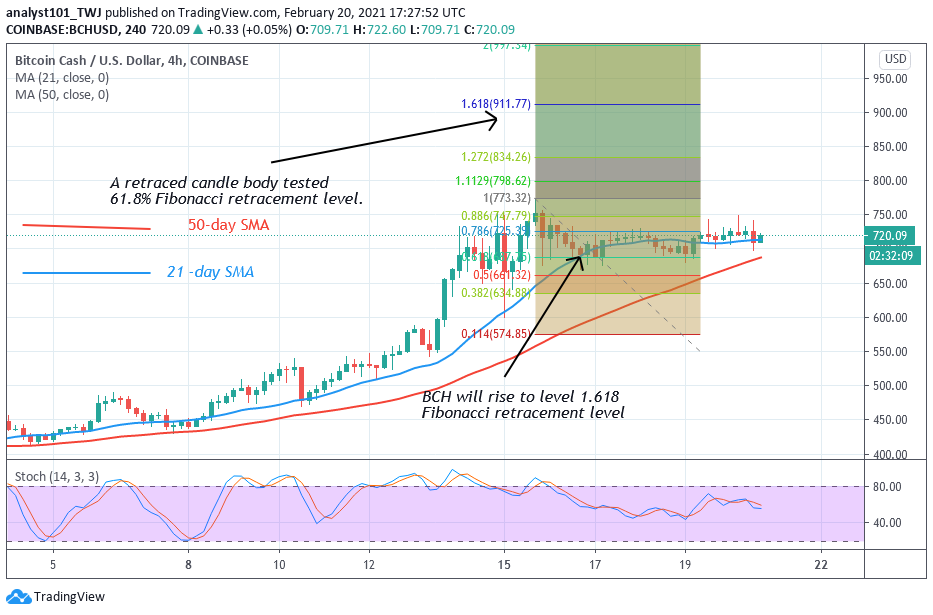
Bitcoin Cash can move up to $900 high if the overhead resistance is breached. Conversely, the crypto can equally fall, if the bears break the current support at $650. BCH will decline to the low at $550. Despite, the present range-bound movement, BCH is likely to rise. On February 15 uptrend; the retraced candle body tested the 61.8% Fibonacci retracement level. The retracement indicates that BCH will reach level 1.618 Fibonacci extension or the high of $911.77.


