Bitcoin’s (BTC) price and the other cryptos are still battling with downward correction. BTC price will be out of downward correction if the bulls clear the resistance zones between $39,000 and $40,330 price levels. The altcoins need a strong bounce to be out of downward correction.
BTC/USD Major Trend: Bearish
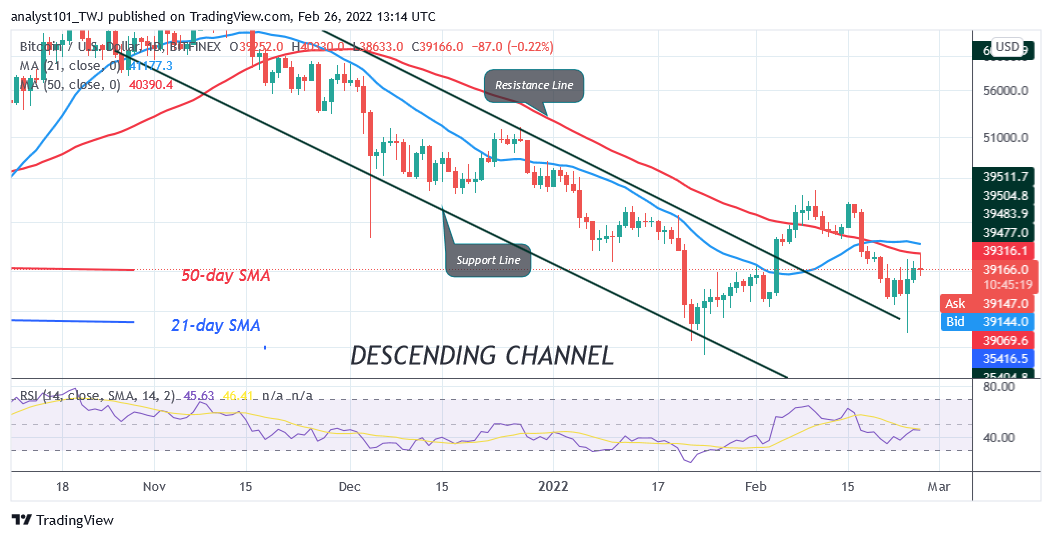
Bitcoin’s (BTC) price has fallen below the moving averages and it is trading in the bearish trend zone. On February 24, BTC /USD plunged to $35,007 as bulls bought the dips. BTC price corrected upward and reached the high of $40,330. The upward move was interrupted as Bitcoin reached the overbought region of the market. Bitcoin is fluctuating above the $39,000 support after a minor retracement.
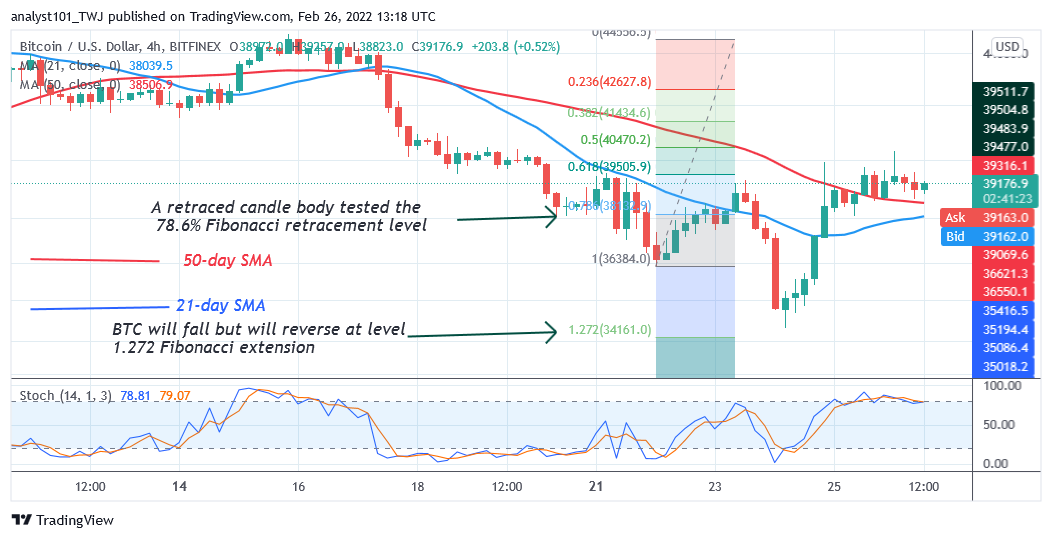
On the upside, if BTC’s price rebounds above the current support, Bitcoin will rally to $45,000 high. In the same vein, if the bulls overcome the $45, 000 overhead re4sistnce, Bitcoin is capable of rallying above the $50,000 psychological price level. Conversely, if the bullish scenario is invalidated, BTC/USD will be compelled to range-bound move between $35,000 and $39,000 price levels. Alternatively, the bears will attempt to break below the $35,000 support. If the bears are successful, Bitcoin will be faced with deeper correction.
XRP/USD Major Trend: Bearish
On the daily chart, Ripple’s (XRP) price has broken below the moving averages. Today, the crypto’s price is above the 50-day line moving average but below the 21-day line moving average.
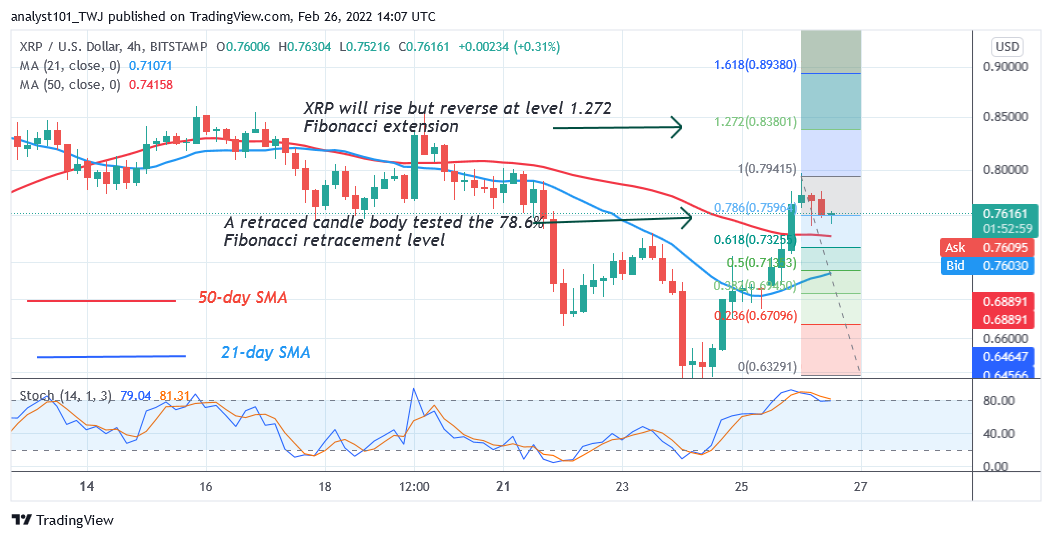
The implication is that XRP will be compelled to range-bound move. On the 4-hour chart, XRP is above the moving averages. The altcoin is capable of making a marginal upward move. Meanwhile, on February 25 uptrend; a retraced candle body tested the 78.6% Fibonacci retracement level. The retracement suggests that XRP will rise but reverse at level 1.272 Fibonacci extension or $0.83. Nonetheless, if XRP rises and breaks above the $0.90 resistance the altcoin will rise above the $1.00 overhead resistance.
DOT/USD Major Trend: Bearish
Polkadot’s (DOT) price is in a downward correction as price breaks below the moving averages. The cryptocurrency fell to the low of $15.93 as bulls bought the dips. The altcoin has fallen to the previous low of January 24. The current price level is the oversold region of the market.
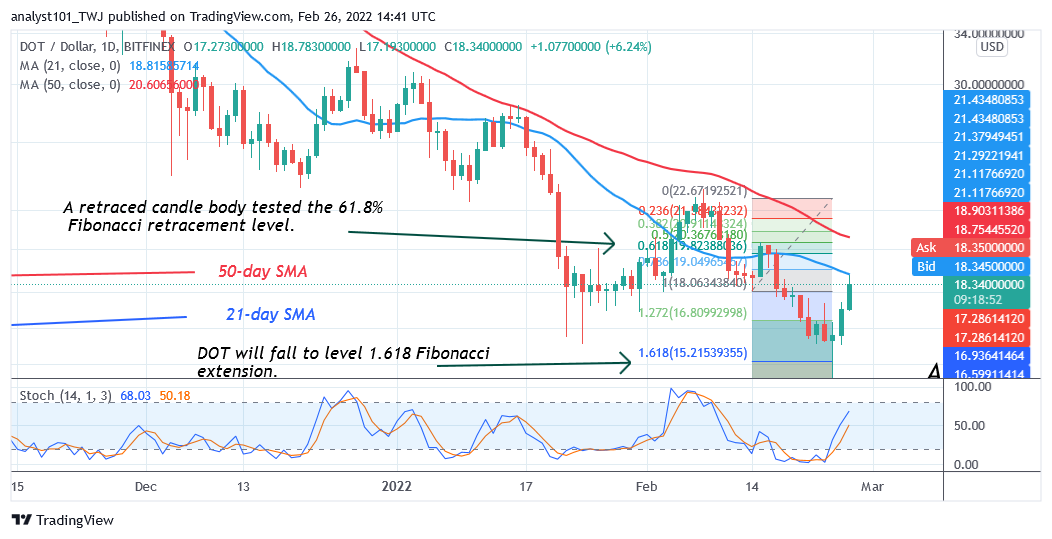
DOT/USD has reached the oversold region as buyers emerge from it. Meanwhile, on February 15 downtrend; a retraced candle body tested the 61.8% Fibonacci retracement level. The retracement suggests that XRP will fall to level 1.618 Fibonacci extension or $15.21. From the price action, XRP has fallen to the low of $15.93 and resumed upward. Presently, the DOT price is approaching the 21-day line moving average. The crypto will resume upside momentum if price breaks above the moving averages. The downward correction will resume if it faces rejection at the recent high.
LTC /USD Major Trend: Bearish
Litecoin’s (LTC) price is in a downward correction as the altcoin revisits the previous low. On January 22 price slump, Litecoin traded and declined to the low of $96 as bulls bought the dips. LTC price corrected upward and broke above the moving averages.
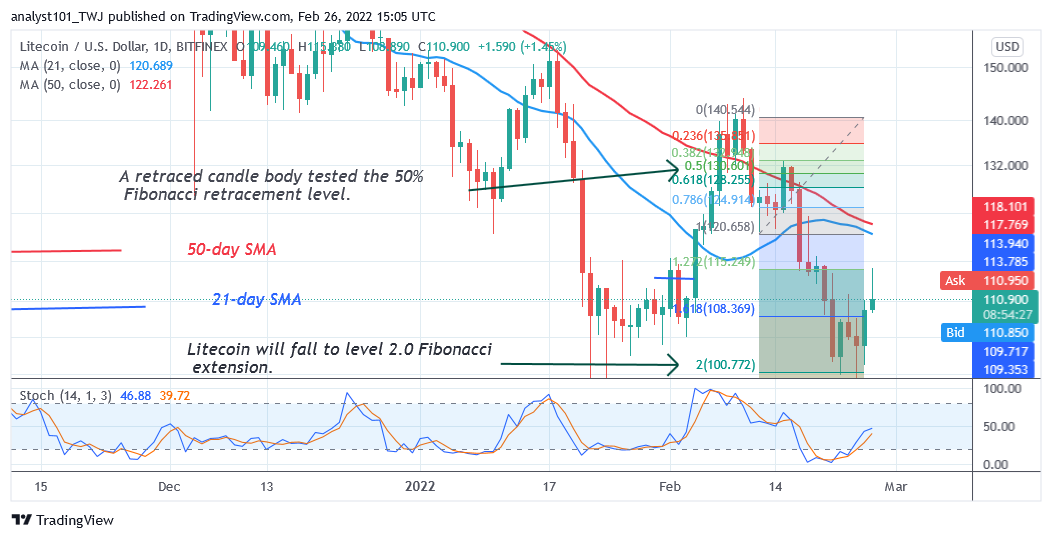
Today, the LTC price has fallen to the previous low because of the rejection at $140. Meanwhile, on February 12 downtrend; a retraced candle body tested the 50% Fibonacci retracement level. The retracement suggests that LTC will fall to level 2.0 Fibonacci extension or $100.77. From the price action, the LTC price has retested the 2.0 Fibonacci extension and reversed. LTC/USD will resume upside momentum if the resistance at $140 is breached.
LINK /USD Major Trend: Bearish
Chainlink’s (LINK) price is in a downward correction as the crypto breaks below the previous low at $13. On February 24, the bears broke below the previous low but rebounded above the $13 support.
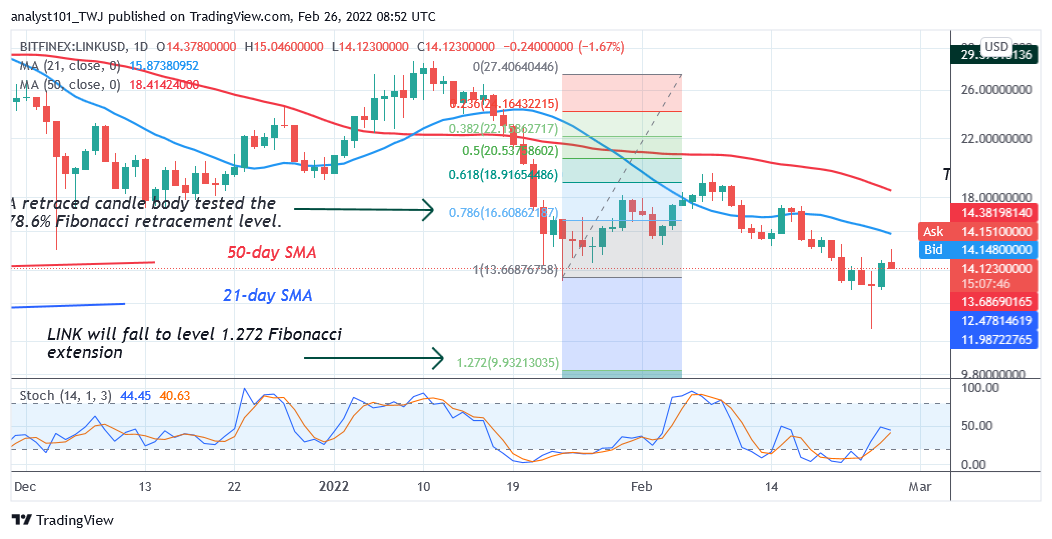
Today, LINK/USD is trading at $14.30 at the time of writing. Chainlink is likely to hold above the previous low at $13. It is the historical price level of July 21, 2021 price level. Meanwhile, on February 24 downtrend, a retraced candle body tested the 78.6% Fibonacci retracement level. The retracement suggests that LINK will fall to level 1.272 Fibonacci extension and reverse. From the price action, Chainlink has reversed at $11 low and resumed upward.


