

Bitcoin has been in a downward correction after its rejection from the $58,000 overhead resistance.
Bitcoin’s upward move depends upon the bulls sustaining the price above the $44,000 support.
Ethereum and the other altcoins are in a downward correction. The price action is indicating bullish signals for a possible upward move of the coins.
BTC/USD Major Trend: Bearish
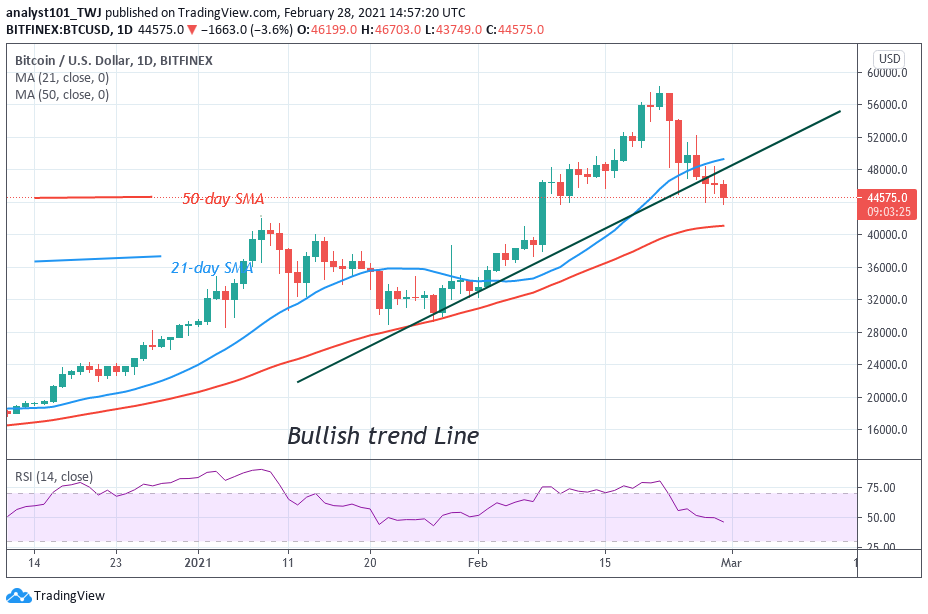
For the past week, Bitcoin bulls failed to sustain above the $58,000 resistance on February 21. The resultant effect was that BTC price crashed to $44,000 low on February 26. After the breakdown, the price corrected upward but it faced another rejection from the $51,000 and $52,000 highs. For the past three days, the BTC price has been fluctuating between $44,000 and $48,000 price levels. On the downside, if the bears break the $44,000 support, the king coin will be weakened and may slump to $38,000 low. Similarly, if the current support holds, the BTC price will rise to retest the $52,000 resistance.
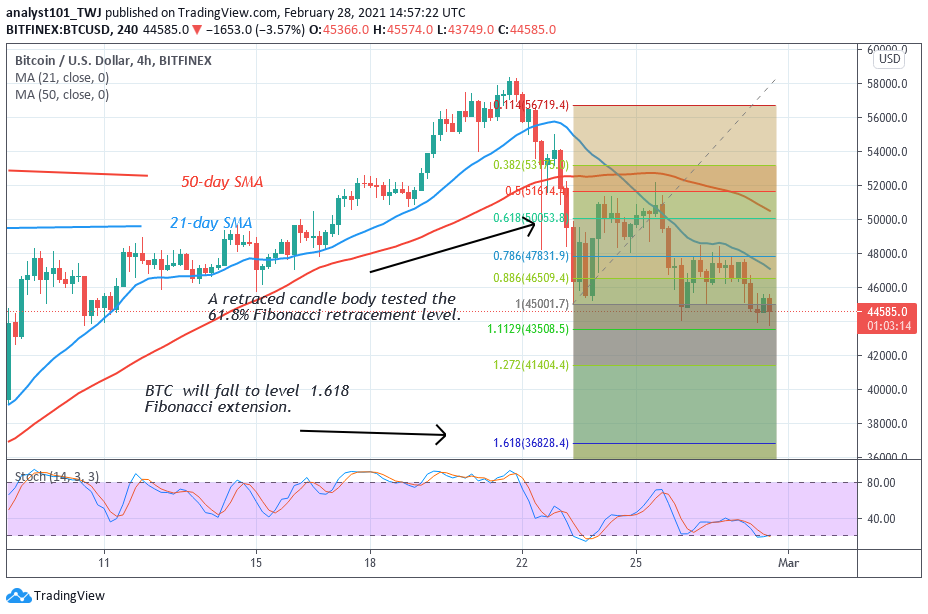
A break above the $52,000 resistance will signal the resumption of upside momentum. On February 23 downtrend; a retraced candle body tested the 61.8% Fibonacci retracement level. The retracement indicates that BTC price will fall to level 1.618 Fibonacci extension or the low of $36,828.40. However, if the $44,000 support holds, it will invalidate the Fibonacci tool analysis.
ETH/USD Major Trend: Bearish
The biggest altcoin also slumped from its peak price of $2,000 to $1,400 in the previous week. After the breakdown, the price corrected upward to $1,700 high. The upward correction was short-lived as bears pushed the price below $1,400 support.
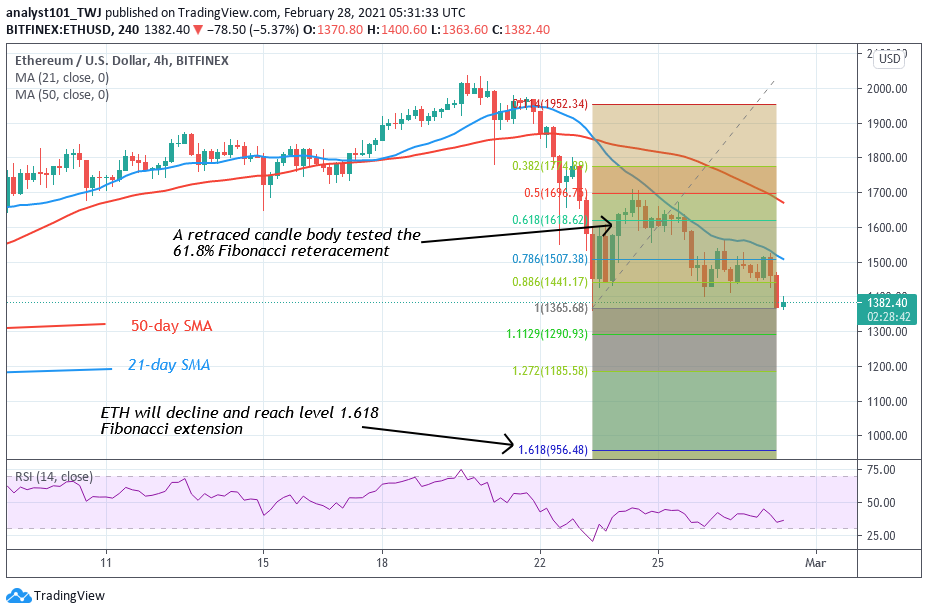
Presently, the market has broken below the current support at $1,400. There is a danger of further decline of price to the lows of either $1,000 or $1,200. Nonetheless, the Fibonacci tool has indicated a further downward movement of the coin. On February 23 downtrend; a retraced candle body tested the 61.8% Fibonacci retracement level. This retracement implies that ETH will fall to level 1.618 Fibonacci extension or the low of $943.54.
XRP /USD Major Trend: Bearish
In the previous week, XRP has a price spike as the altcoin reached a high of $0.65. In a swift rejection, the crypto fell immediately to the low of $0.39. The price has fallen to the support of the 50-day SMA. It appears if the price breaks the 50-day SMA, Ripple will fall into the bearish trend zone.
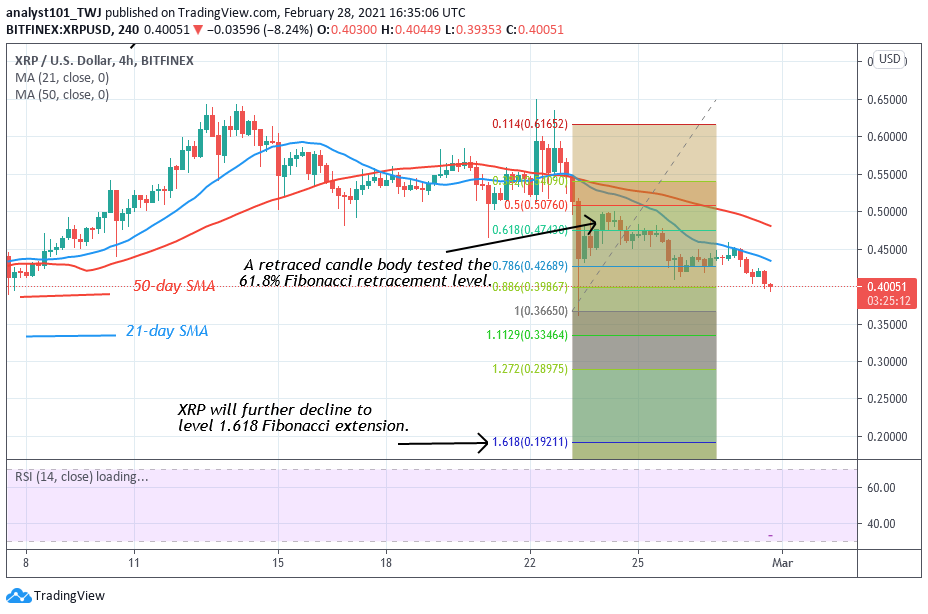
On the downside, XRP is likely to decline to the previous low at $0.35. The downtrend will resume if the bears break the $0.35 support. Presently, XRP is fluctuating between $0.40 and $0.50. The price action is characterized by small body candlesticks. On February 23 downtrend; a retraced candle body tested the 61.8% Fibonacci retracement level. The retracement implies that Ripple will fall to level 1.618 Fibonacci extension or $0.19 high. This will depend on the bears’ breaking the $0.35 support level.
BCH /USD Major Trend: Bearish
Last week, BCH was in a downward move after the rejection at the $700 high. The altcoin dropped to $445 low and corrected upward. The upward correction was terminated at the $560 high.
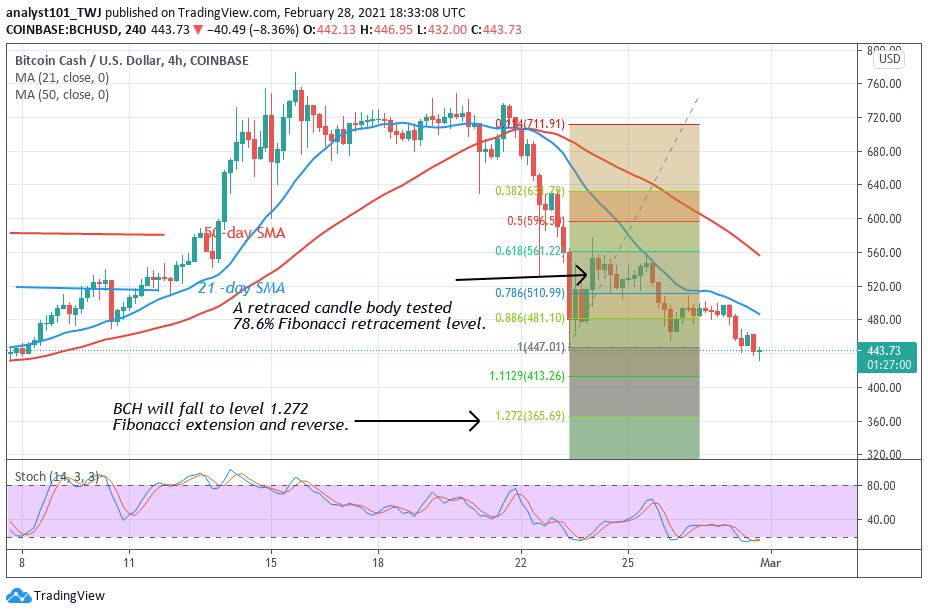
The market has resumed a downward move after the second rejection. BCH will continue its downward move if the price breaks the previous low at $445. Nevertheless, on February 23 downtrend; the retraced candle body tested the 78.6% Fibonacci retracement level. The retracement indicates that BCH will reverse at level 1.272 Fibonacci extension or the low of $365.69.


