
Bitcoin’s (BTC) price has rebounded above the $37,000 support as the largest cryptocurrency reclaims the $40,000 psychological price level. Further upsides are pending once the bulls clear the $42,000 to $44,000 resistance zones. The recent price rebounds have been extended to some altcoins like XRP, DOT, and LTC as they break their next resistance levels.
BTC/USD Major Trend: Bullish
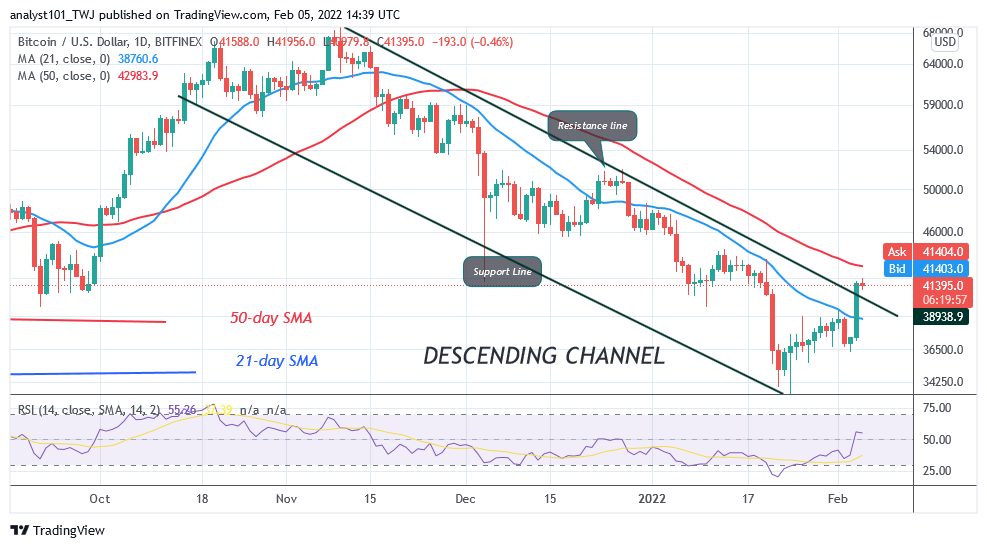
Bitcoin’s (BTC) price rebounds above the $37,000 support as it rallied above the $41,000 price level. The price rebound has cleared the $38,000 to $39,000 resistance zones. The bullish momentum is expected to reach the $44,000 high. The largest cryptocurrency also breaks above the 21-day line moving average. A break above the 50-day line moving average will signal the resumption of upside momentum.
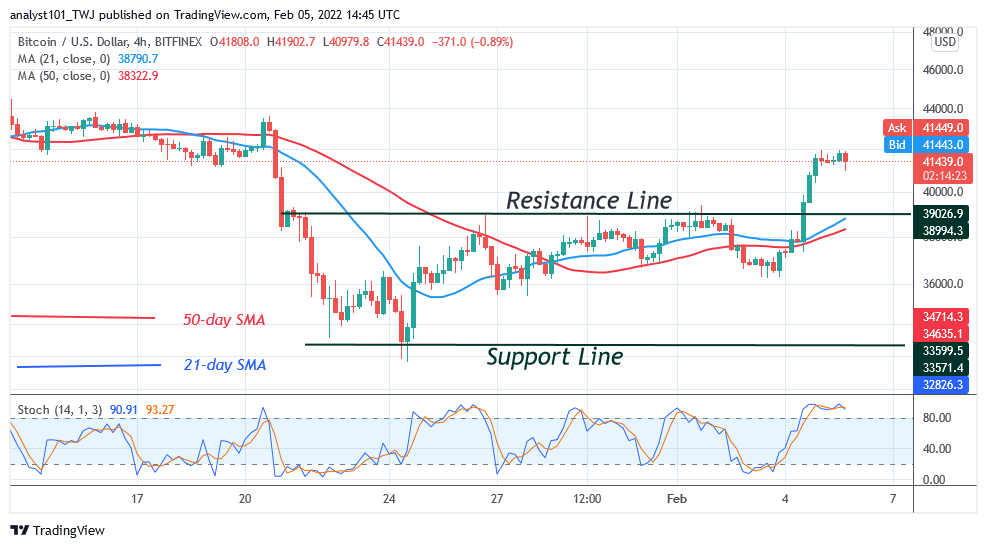
The cryptocurrency has rallied to a high of $41,753. Today, the bullish momentum has been stalled below the $42,000 resistance level. BTC price is fluctuating below the recent high. Further upward move is likely. The next hurdle for Bitcoin bulls is to clear the resistance zones between the $42,000 and $44,000 price levels. If buyers overcome the next hurdle, BTC’s price will rally to the $51,000 price level. However, if the bullish momentum is invalidated, the cryptocurrency will be compelled to a range-bound move below the $42,000 resistance level.
XRP/USD Major Trend: Bearish
Ripple’s (XRP) price rebounded above the $0.60 support as bulls broke the price range between $0.54 and $0.65. The bullish momentum also broke above the 21-day line moving averages. On the daily chart, if the bullish momentum extends above the 50-day line moving average, it will signal the resumption of upside momentum.
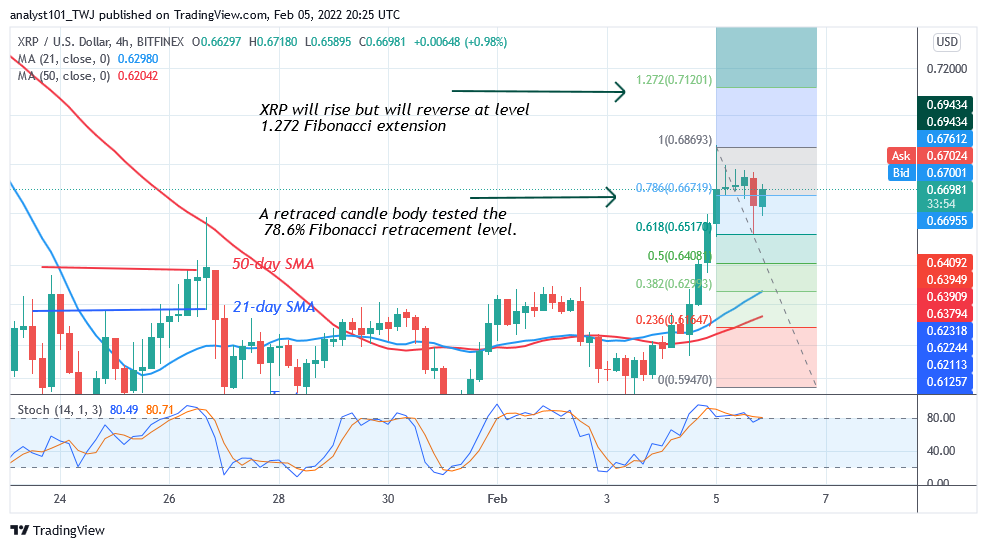
In today’s bullish movement, XRP broke the $0.65 resistance to reach the high of $0.6875. The altcoin retraced to the support above $0.65. The market has begun a fresh uptrend. If buyers succeed in keeping the price above the recent high, XRP will rise and attain another high of $0.80. Meanwhile, on February 5 uptrend; a retraced candle body tested the 78.6% Fibonacci retracement level. The retracement suggests that XRP will rise but reverse at level 1.272 Fibonacci extension or $0.71. The altcoin will revert to the 78.6% Fibonacci retracement level where it originated.
DOT/USD Major Trend: Bearish
Polkadot’s (DOT) price has been in a sideways trend since January 22 as it fluctuates between $16 and $20. Today, the bulls have broken the $20 resistance. In other words, the bulls have broken above the 21-day line moving average on the daily chart.
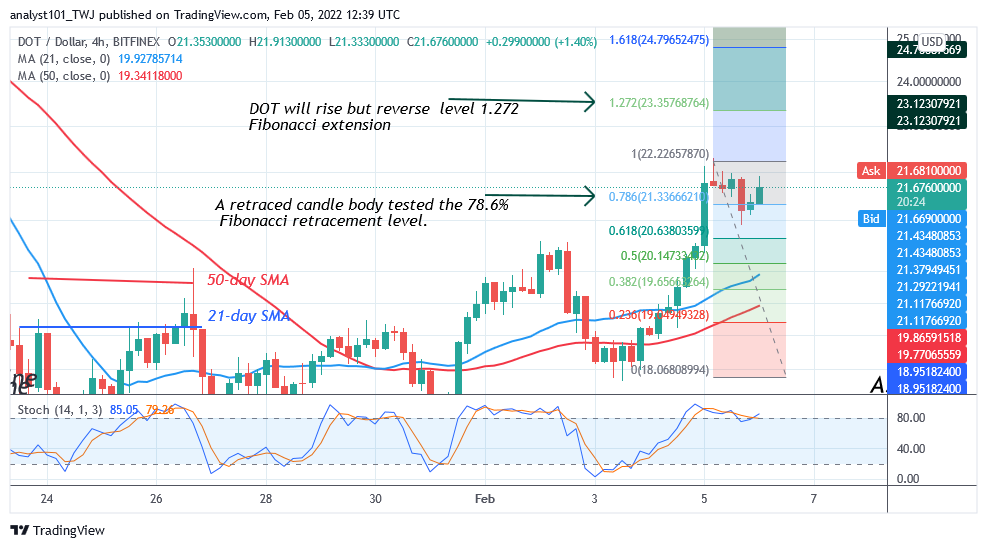
Polkadot will be out of downward correction if the bulls break above the 50-day line moving average. DOT price will be range-bound between the moving averages if the 50-day line moving average remains unbroken. Besides, the market will rally to $30. On the 4 hour chart, a retraced candle body tested the 78.6% Fibonacci retracement level. The retracement suggests that XRP will rise but reverse at level 1.272 Fibonacci extension or $23.35. The altcoin will reverse to 78.6% Fibonacci retracement level where it originated.
LTC /USD Major Trend: Ranging
Since January 22, Litecoin’s (LTC) price has been in a range-bound move. The cryptocurrency has been fluctuating between $96 and $116 price levels. Today, the bulls have broken the range-bound move as price rallied to $122 at the time of writing.
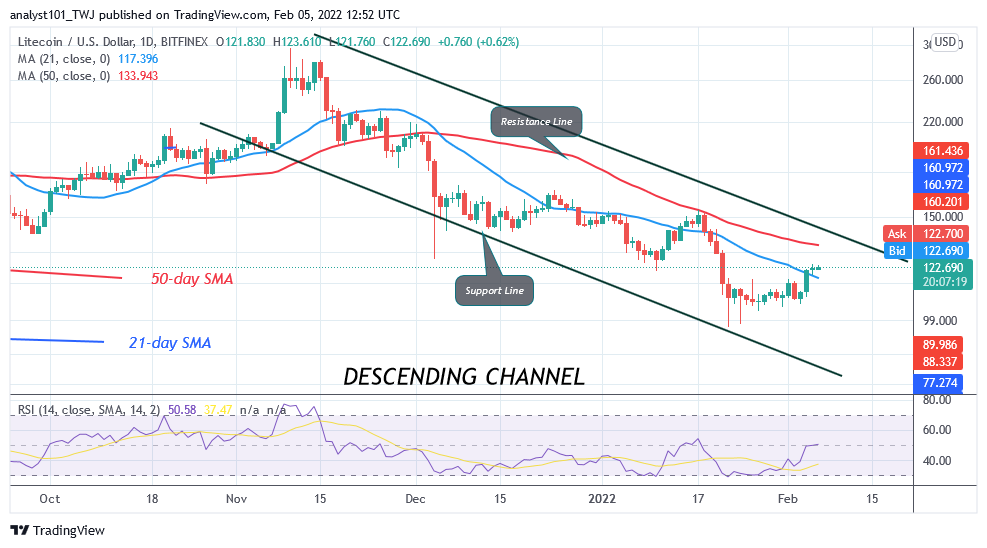
The bullish momentum broke above the 21-day line moving average but it is below the 50-day line moving average. On the upside, the bullish momentum is likely to extend to the high of $143. Nonetheless, if the uptrend breaks above the 50-day line moving average, LTC will rally above $143. The altcoin will be out of downward correction. Conversely, if Litecoin turns from the 50-day line moving average, LTC/USD will be range-bound between the moving averages.
LINK /USD Major Trend: Bearish
Chainlink’s (LINK) price has resumed a sideways trend after the January 24 price slump. For the past two weeks, sellers and buyers have been in price tussle between $14 and $18 price levels.
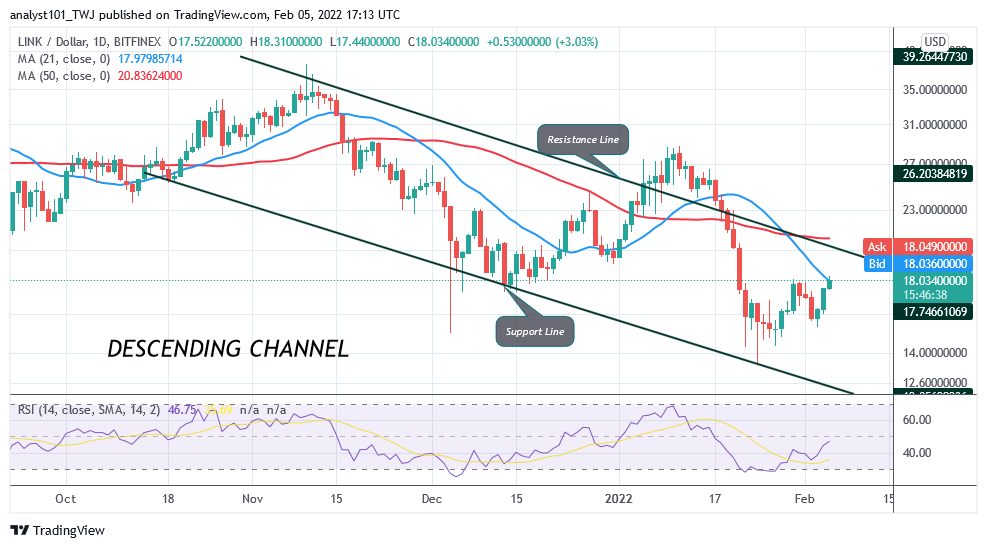
Neither the bulls nor the bears have been able to breach the range-bound levels. Today, the altcoin is facing rejection at the $18 high as the market reaches the overbought region. Chainlink will rally to the $28 high if the bulls are successful above the recent high. The downward correction between $14 and $18 will continue if Chainlink faces rejection at $18 resistance. In other words, LINK/USD will fall, if it faces rejection at the 21-day line moving average.


