

Bitcoin bulls have cleared the $35,000 resistance and reclaimed the psychological price level of $40,000., Can bulls resume the upside momentum? Perhaps, when the $40,500 resistance is breached, Bitcoin will resume upside momentum. The biggest altcoin is surging ahead as it eyes the $2000 price level. BCH and XRP lack buyers at higher price levels.
BTC/USD Major Trend: Bullish
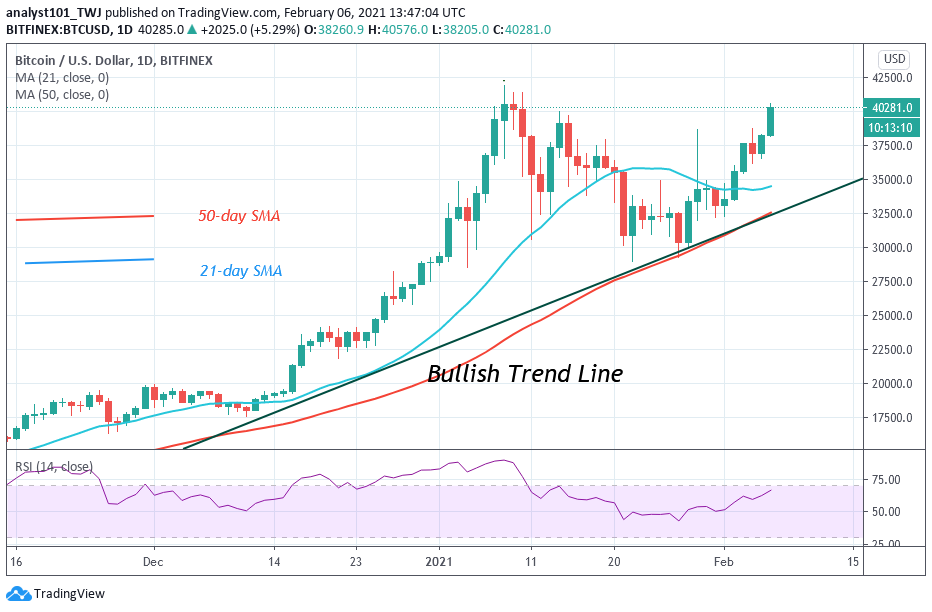
In the previous week, Bitcoin bulls reclaimed the $34,500 support and cleared the $35,000 resistance. This propelled the BTC price to resume an upward move to the psychological price level of $40,000 high. Today, buyers are attempting to break the $40,500 high. It is likely the bulls are going to face rejection at the $40,500 resistance. This will cause Bitcoin to decline again to the lows either of $36,000 or $35,000 low. Conversely, if the bulls break the $40,500 resistance and the bullish momentum is sustained, Bitcoin will resume upside momentum. BTC price will rally above $45,000. The next target price will be the next psychological price level of $50,000.
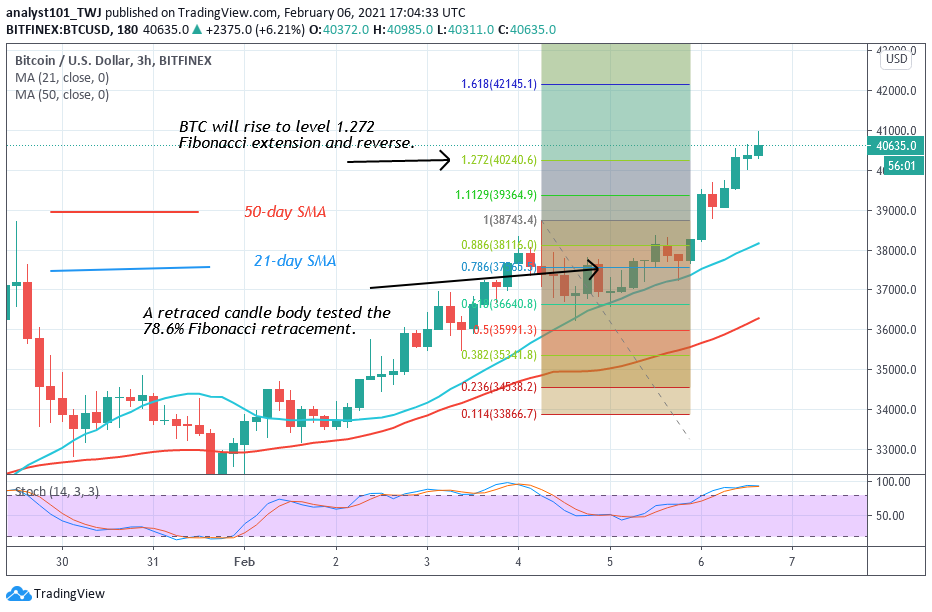
Nevertheless, the Fibonacci tool has indicated an upward move of the king coin. On February 4 uptrend, a retraced candle body tested the 78.6% Fibonacci retracement level. The retracement indicates that BTC price will rise to level 1.272 Fibonacci extension or the high of $40,240.60. Later, BTC price will reverse from the recent high to 78.6% Fibonacci retracement level. Meanwhile, from the price action, the BTC price is trading at $40,465 at the time of witting.
ETH/USD Major Trend: Bullish
For the past week, the Ethereum price was stuck below the $1,440 overhead resistance. Buyers have made concerted efforts to break the resistance but were repelled. On February 2, the bulls broke the resistance as Ether rallied to $1,667. The recent breakout accelerated price movement on the upside. Ether attained the next target price of $1,675. The bullish momentum continued as the altcoin reach a new high of $1,760. The uptrend could not be sustained as the coin reached the overbought region of the market. Presently, the coin is fluctuating between $1,640 and $1,760. On the upside, if price breaks the $1,760 resistance, the market will rise to reach the targeted price level of $2,000.
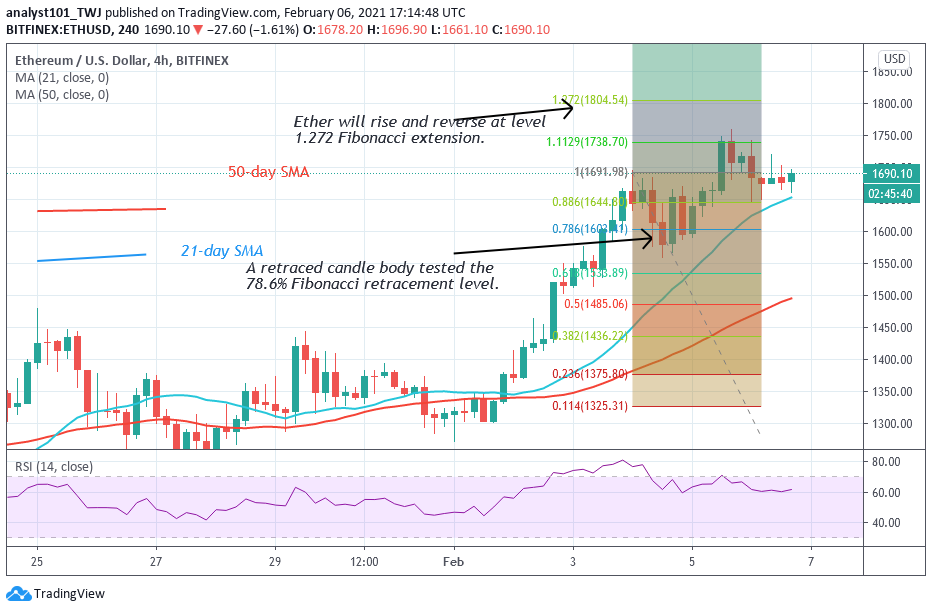
Otherwise, the current fluctuation will continue until a breakdown or breakout occurs. Nonetheless, the Fibonacci tool has indicated an upward movement of the coin. On February 4 uptrend; a retraced candle body tested the 78.6% Fibonacci retracement level. This retracement indicates that ETH will rise to level 1.272 Fibonacci extension or the high of $1,804.54. At the recent high of $1,804.54, the market will reverse and returned to the 78.6 % Fibonacci retracement level where it originated.
XRP /USD Major Trend: Bullish
Ripple was in an uptrend in the previous week. On February 1, the coin rallied to $0.75 high. However, within a minute the coin dropped down to the previous support. The coin fell and resumed consolidation above the $0.35 support. The price action is characterized by small body indecisive candlesticks. These small body candlesticks are indicating that buyers and sellers are undecided about the direction of the market. Yesterday, Ripple bulls made positive moves into the previous highs after a disappointing price spike. The Fibonacci tool has indicated an upward of the coin.
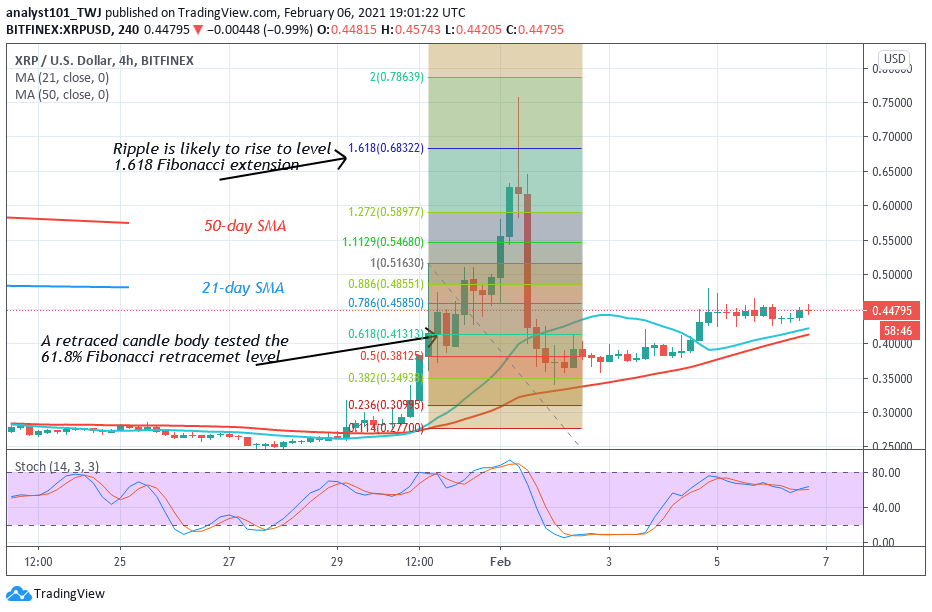
On January 29 uptrend; a retraced candle body tested the 61.8% Fibonacci retracement level. The retracement implies that Ripple will rise to level 1.618 Fibonacci extension or $0.683 high. The recent rally surpassed that level but pulled back to the Fibonacci level. This week there is the possibility of further upside momentum.
BCH /USD Major Trend: Bullish
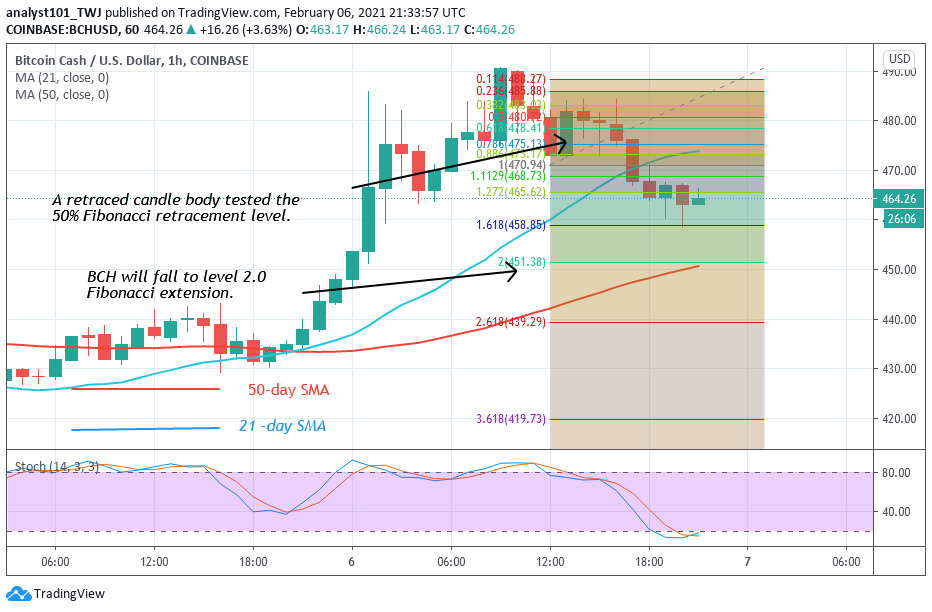
Bitcoin Cash bulls have broken the $440 resistance as the coin reached the high of $480. The bulls have broken the resistance but were repelled at the $480 high. The coin is now on a downward move and it may fall and find support above the breakout level of $440. BCH has retraced to $464 after the rejection at the recent high. Meanwhile, on February 6 downtrend; the retraced candle body tested the 50% Fibonacci retracement level. The retracement indicates that BCH is likely to fall to level 2.0 Fibonacci extensions. In other words, BCH will decline to a low of $451. At that level, the altcoin will resume a fresh uptrend.


