
Bitcoin has resumed a downward correction as cryptos battle the next resistance. The cryptocurrency fluctuates between $40,100 and $44,000 price levels. Buyers are having an uphill task breaking above the $44,000 high. Similarly, the altcoins except Chainlink are still in a downward correction. The cryptos are struggling to break above the next resistance levels. Chainlink has regained bullish momentum and it is trading above the moving averages.
BTC/USD Major Trend: Bearish
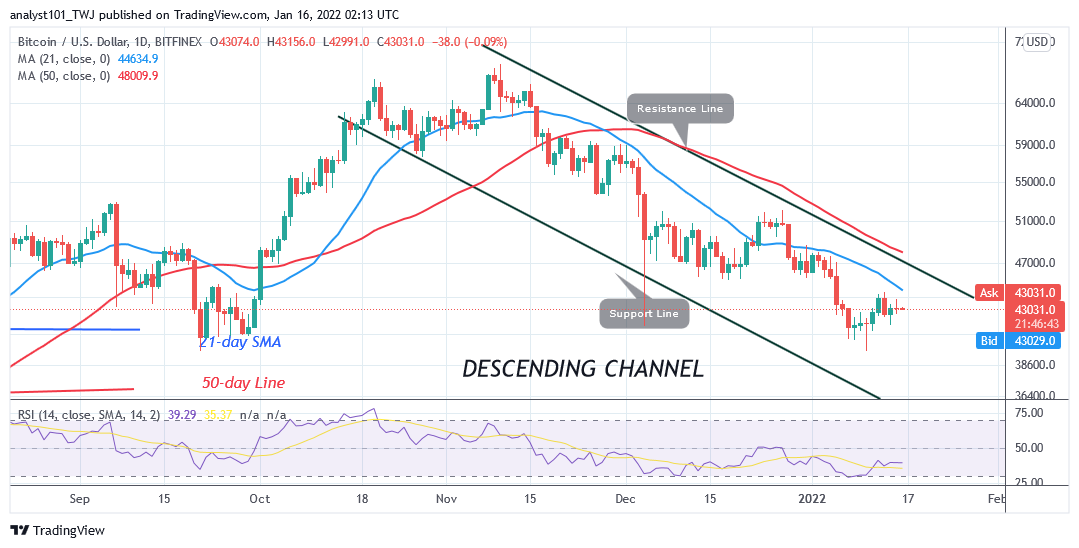
Bitcoin’s (BTC) price is in a downward correction as price fluctuates between $40,100 and $44,000 price levels. Since January 7 price slump, the bears have been retesting the $40,000 support to break below it. On each retest at the $40,000 support, the bulls will buy the dips. The price action is characterized by long tails of candlesticks above the $40,000 support. The long tails indicate that the current support is a strong buying pressure.
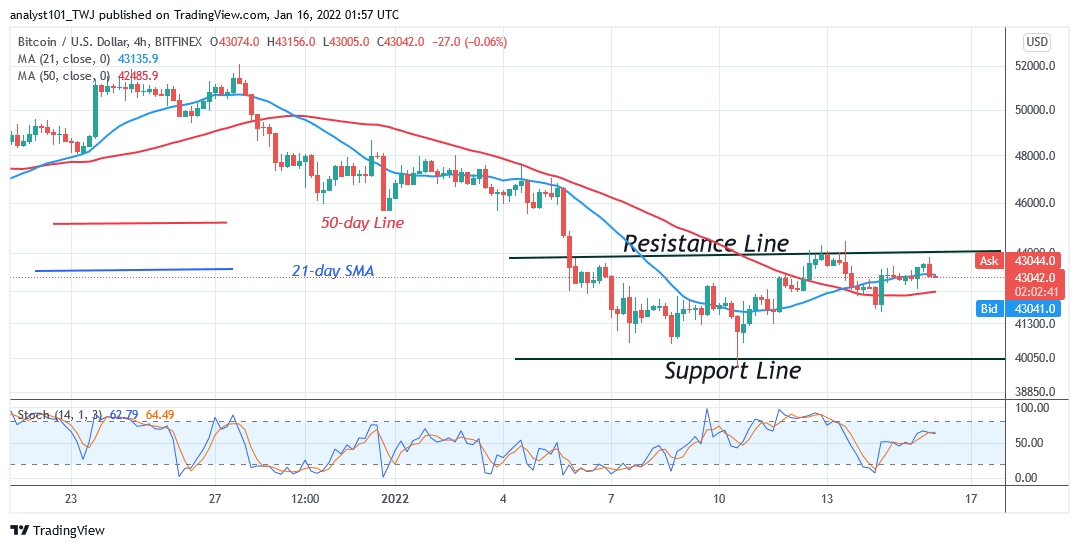
The bears are finding it difficult to break below the current support. Similarly, the bulls have made several attempts to break above the $44,000 resistance. On the upside, a break above the $44,000 support is an indication that the downward correction is over. BTC price will rally to the $47,000 high. If price breaks above the $49,000 high, Bitcoin will be out of downward correction. However, BTC/USD will continue to fluctuate between $40,100 and $44,000 if the bullish scenario is invalidated.
XRP/USD Major Trend: Bearish
Ripple’s (XRP) price is in a downward correction as the altcoin struggles below the $0.80 price level. On January 12, the bulls attempted to break above the $0.80 high but were repelled. The market slumped to $0.76 support and resumed upward. On the upside, if the bulls overcome the $0.80 high, XRP will rally to a $1.00 high. Nonetheless, a breakout above the $1.00 will signal the resumption of the uptrend.
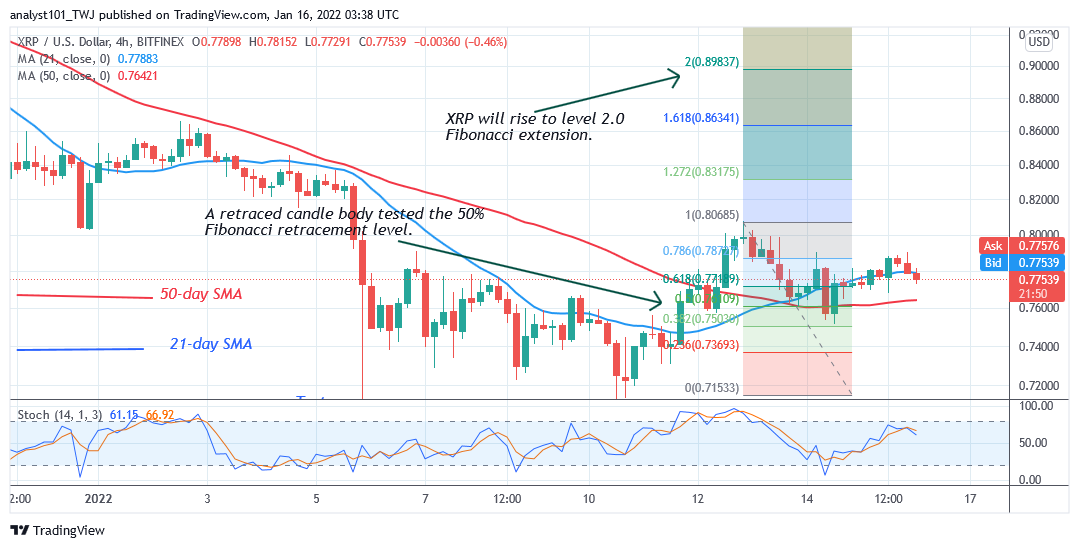
The bullish momentum will extend to the high of $1.30. Conversely, the market will decline to a $0.57 low if the bears break below the $0.76 support. The $0.57 price level is the previous low of the December 4 price slump. Meanwhile, on January 12 uptrend; a retraced candle body tested the 50% Fibonacci retracement level. The retracement suggests that XRP price will rise to level 2.0 Fibonacci extension or $0.89. From the price action, buyers are still struggling to break above $0.80 resistance.
DOT/USD Major Trend: Bearish
On the daily chart, Polkadot’s (DOT) price is in a downward correction as price fluctuates between the 21-day SMA and 50-day SMA. The cryptocurrency will resume trending when the moving averages are broken. Presently, the upward move is hindered at the $28 resistance level.
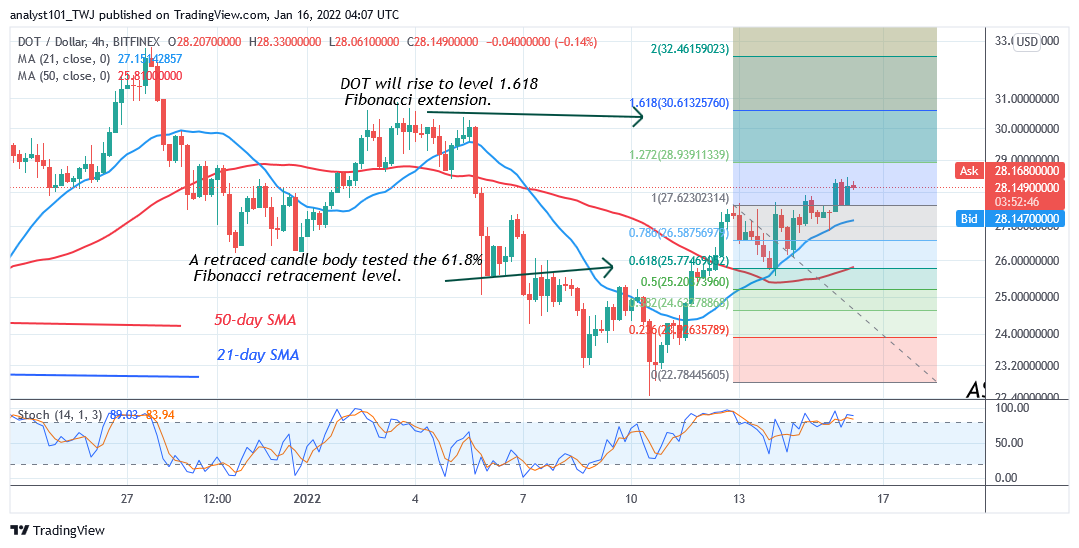
On the upside, if price breaks the $28 high or the 50-day line moving average, the market will rally upward to retest the $32 resistance. A break above the $32 resistance will catapult the altcoin to the high of $38. Conversely, if price retraces and breaks below the $25 support, Polkadot will revisit the previous low of $23. On the 4 hour chart; a retraced candle body tested the 61.8% Fibonacci retracement level on January 12 uptrend. The retracement indicates that DOT price will rise to level 1.618 Fibonacci extensions or $30.61
LTC /USD Major Trend: Bearish
On the daily chart, Litecoin’s (LTC) price is fluctuating between the 21-day line and the 50-day line. A break above or below the moving average will determine the direction of the market. Today, the uptrend is facing resistance at the high of $150. It is because the market is approaching the overbought region.
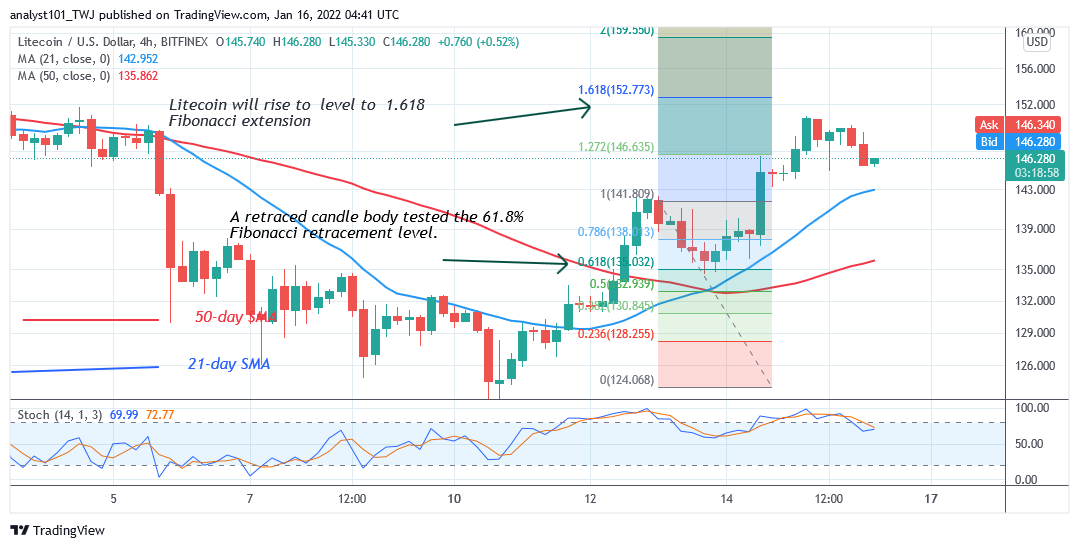
On the upside, if the LTC price rebounds, the initial resistance will be broken. The market will rise to retest the $165 high. The up trending will resume if the bulls break above the $165 high. Conversely, if the bears break below the 21-day line moving average, the LTC price will drop to $120 low. Meanwhile, on December 13 uptrend; retraced candle body tested the 61.8% Fibonacci retracement level. The retracement indicates that Litecoin is likely to rise to level 1.618 Fibonacci extension or $152.77. From the price action, Litecoin is retesting the Fibonacci extension. Also, it may retrace as the market is in the overbought region.
LINK /USD Major Trend: Bullish
Chainlink’s (LINK) price has regained bullish momentum as cryptos battle the next resistance. Perhaps, this is an indication that the selling pressure has ended. The cryptocurrency tends to rise as it is above the moving averages. Presently, the uptrend is facing resistance at the high of $28.
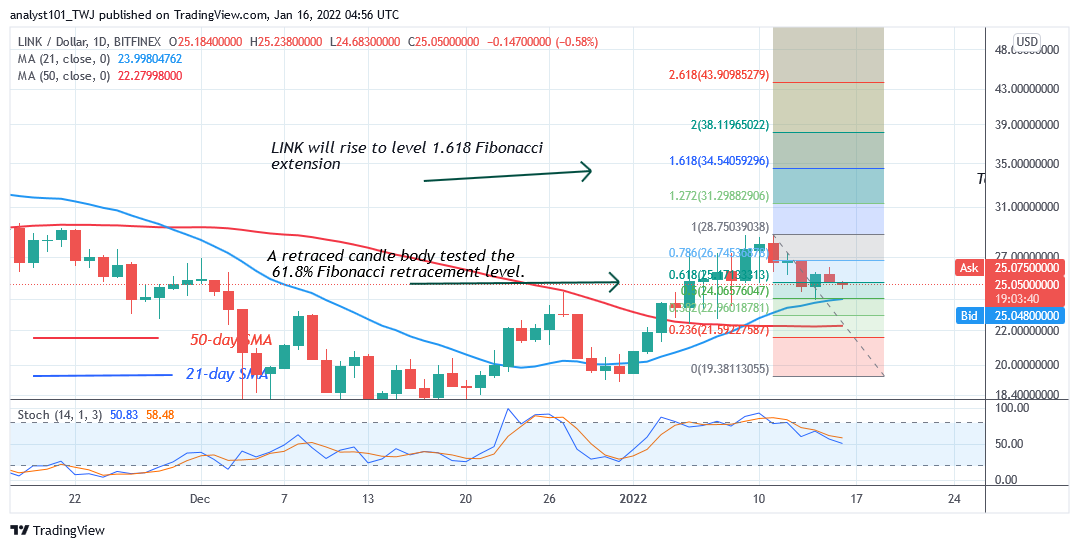
Buyers could not continue the bullish momentum above the recent high as the market reached an overbought region. Chainlink has retraced to the support above the 21- day line moving average. The upward move will resume retesting the recent high. If the current resistance is breached, Chainlink will rise to the previous high of $34.50. Meanwhile, on January 11 uptrend; a retraced candle body tested the 61.8% Fibonacci retracement level. The retracement indicates that LINK will rise to level 1.618 Fibonacci extension or $34,54 high.


