

Bitcoin has been battling with downward correction as the king coin failed to break above the psychological price level of $40,000. The crypto has fallen to the support above $30,000 and pulled back. On January 22, a candlestick has a protruding tail. The long tail indicates that there is strong buying pressure above the $30,000 price level. BTC price is likely to move up this week. The other altcoins are likely to make positive moves.
BTC/USD Major Trend: Bullish
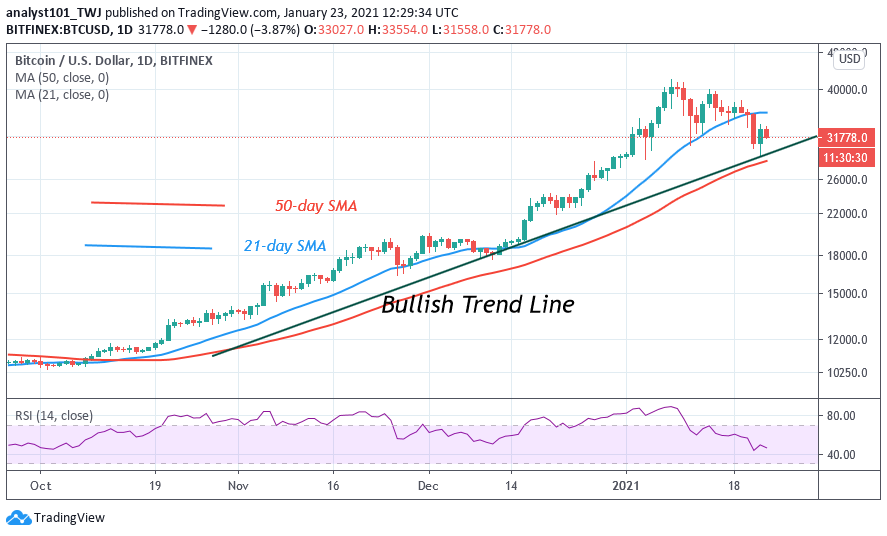
In the previous week, BTC’s price was falling after it failed to break the psychological price level of $40,000 for the second time. The crypto’s price fell to $34,000 low and resumed range bound movement between $34,000 and $38,000. On January 21, the bears broke the range-bound movement after one week of consolidation. That is the $34,000 support was broken as the BTC price declined. The king coin fell to $29,150 low and pulled back. The bulls bought the dips as the price corrected upward. The upward correction was stalled at the $34,000 resistance.
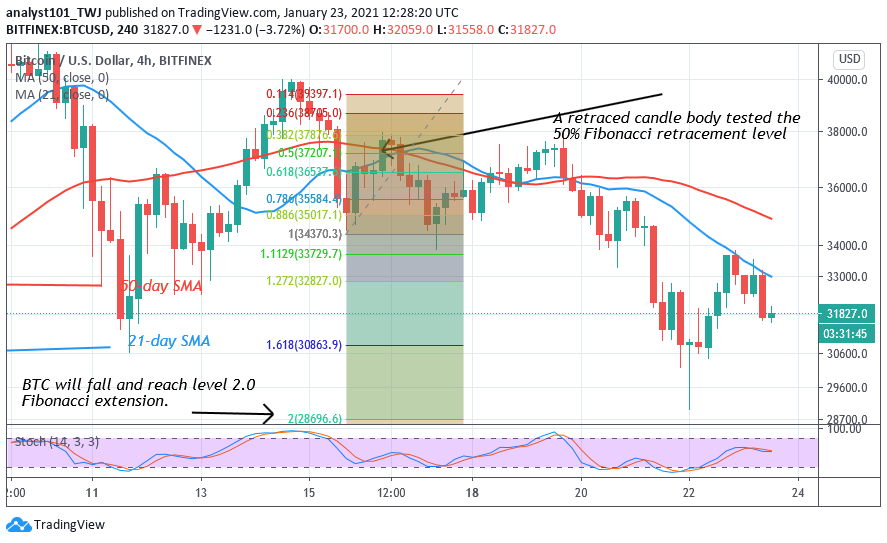
For uptrend resumption, the bulls must break the $34,000 resistance to resume upside momentum. Meanwhile, on January 15 downtrend; a retraced candle body tested the 50% Fibonacci retracement level. At this retracement level, BTC price will fall to level 2.0 Fibonacci extension or the low of $28,696.60. The price action as confirmed this present low as the price corrected upward.
ETH/USD Major Trend: Bullish
For the past week, Ethereum bulls have been in a battle to break the $1,300 resistance. At one time, the resistance was broken but the bullish momentum could not be sustained. At other times, the bulls were repelled and there was price retracement. Nevertheless, on January 19, the $1,300 resistance was broken as buyers pushed the price to $1,434 high. Unfortunately, the uptrend could not be sustained as the crypto reached the overbought region of the market.
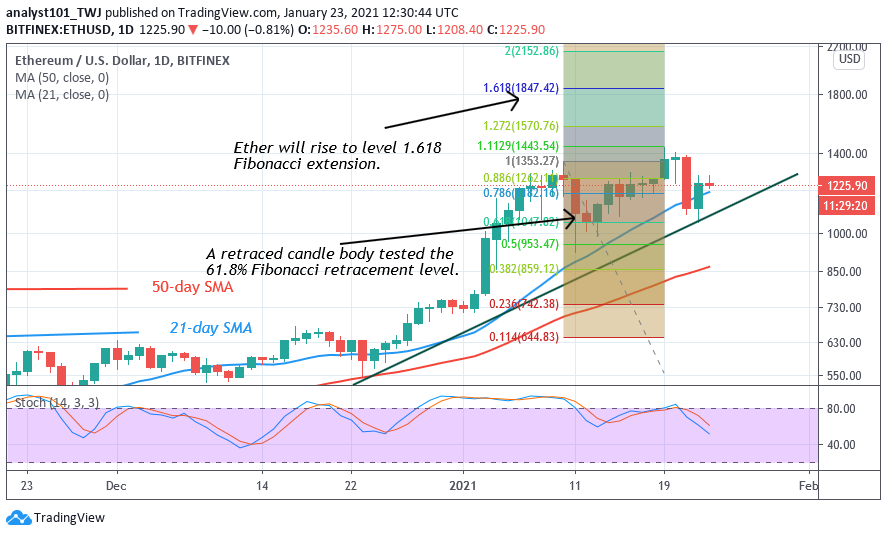
Sellers emerged as crypto dropped from $1,434 to $1,048 low. The bulls have bought the dips as the coin rose above $1,200. The upward move is facing rejection at the $1,300 resistance. A fresh uptrend is likely if buyers succeed in breaking the resistance at $1.300 and $1,434. If the bullish scenarios are favorable, Ether will reach a high of $1,845. Nevertheless, on January 10 uptrend; a retraced candle body tested the 61.8% Fibonacci retracement level. This retracement gives the impression that ETH will rise to level 1.618 Fibonacci extensions or the high of $1,847.42. Ethereum will be compelled to a range-bound movement if the bulls fail.
XRP /USD Major Trend: Bearish
For the past week, Ripple’s upward move has been stuck below the $0.30 high. The bulls have attempted to break above the $0.30 resistance but could not sustain the upward move. Each attempt has resulted in price fluctuating between $0.26 and $0.30. On January 19, the bulls broke the resistance level as price rallied to $0.329 high.
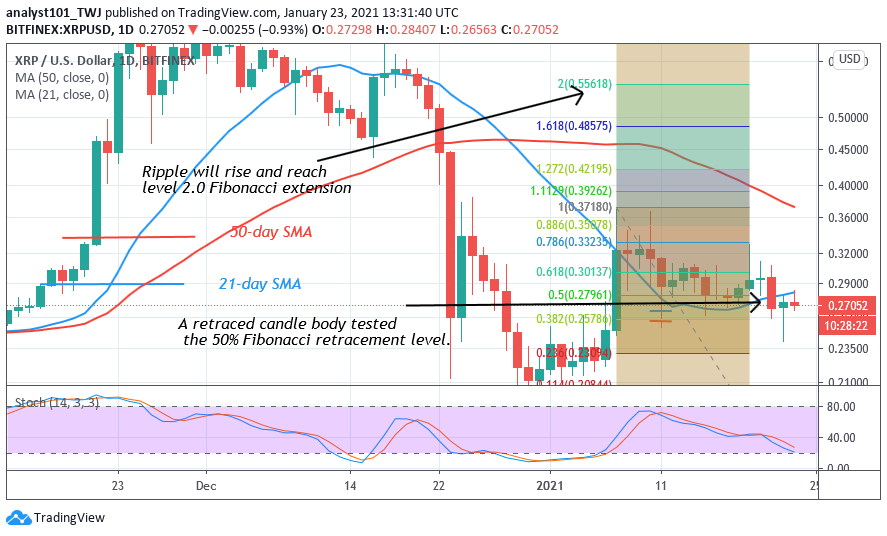
The price spike could not be sustained as there was a pullback above $0.30 support. The selling pressure persisted as the coin dropped again to $0.26 support. The downtrend has resumed as it continued to make lower highs and lower lows. The crypto is presently fluctuating above $0.27 support for a possible upper move. The Fibonacci tool has indicated a possible move of the coin. Meanwhile, on January 7 uptrend; a retraced candle body tested the 50 % Fibonacci retracement level. The retracement implies that Ripple will rise to level 2.0 Fibonacci extension or $0.556 low.
BCH /USD Major Trend: Bearish
In the previous week, Bitcoin Cash has been fluctuating between $470 and $540 since January 11. On January 9, the altcoin has earlier rallied to a high of $654. The uptrend could not be sustained as the coin reached the overbought region of the market. There was a bearish reaction as the coin fell from the high of $654 to $397 low.
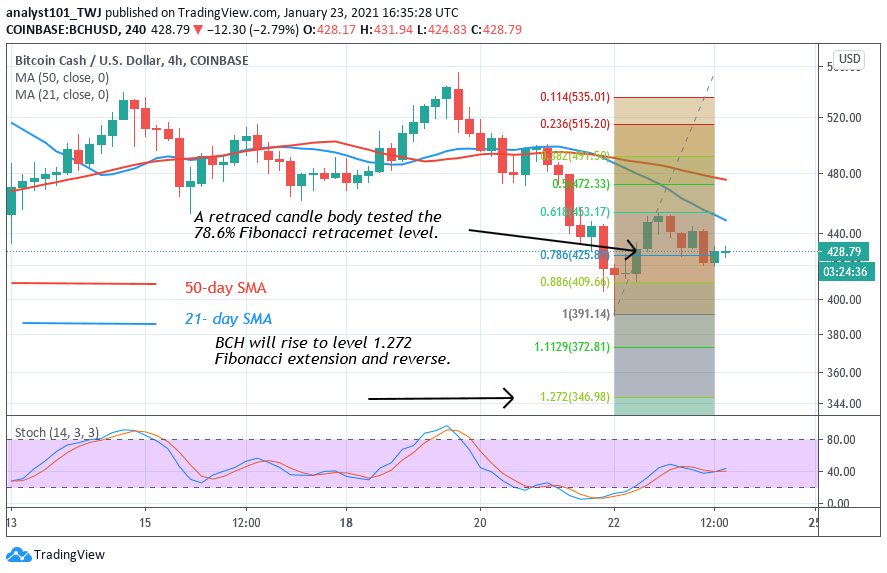
The bulls buy the dips and the coin corrected upward to $540. The upward move was resisted as the coin continued to fluctuate between $470 and $540. On January 21, the bears broke the $470 support as the downtrend resumed. Today, selling pressure is likely to continue as price retest the $440 high. Meanwhile, the Fibonacci tool has indicated a downward movement of the coin. On January 22 downtrend; the retraced candle body tested the 78.6% Fibonacci retracement level. The retracement indicates that BCH is likely to fall to level 1.272 Fibonacci extensions. In other words, BCH will fall to a low of $346.98 and reverse.


