

Bitcoin has been confined in a range between $30,000 and $34,000 since January 22. The confinement was because BTC was rejected from the $40,000 price level. Yesterday, BTC rallied to $38,710 but was immediately repelled to the range-bound zone. Ether, Ripple, and BCH may have a possible upside momentum this week.
BTC/USD Major Trend: Bullish
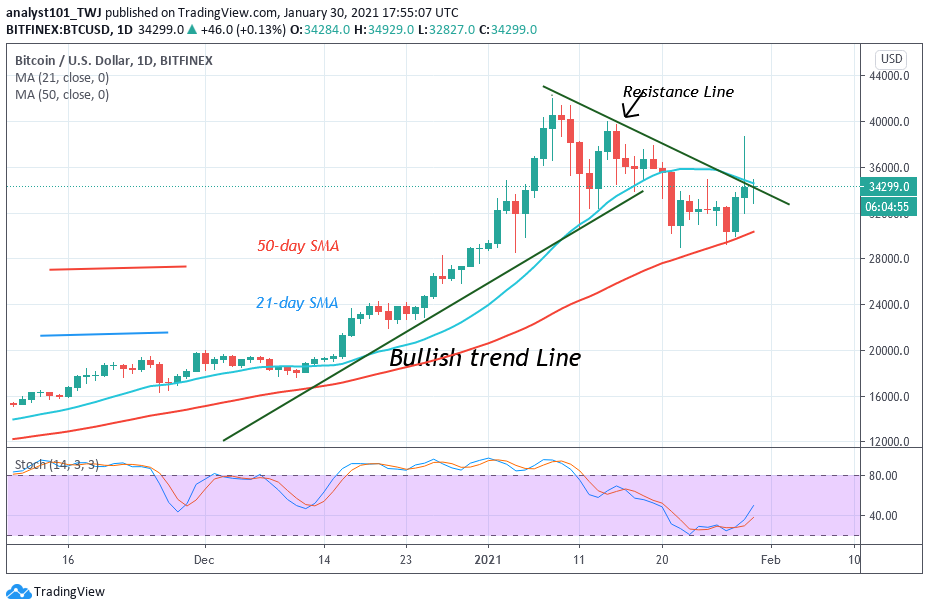
For the past week, the BTC price has been fluctuating between $30,000 and $34,000. The bears attempted to sink the coin twice but were prevented because of strong buying pressure at lower price levels. Sellers pushed the coin to $28,000 low but the bulls ‘buy the dips ‘as Bitcoin recovered from the recent low. The bulls also attempted to break the $34,000 resistance but were repelled. Nevertheless, on January 29, the crypto had a breakout at $34,000 resistance. BTC price rallied to $38,710.70 high. However, the bullish momentum could not be sustained as the bears pushed the price to the previous range-bound zone. This week, the psychological price level of $40,000 is likely to be retested if the bulls sustain the bullish momentum above the $34,000 support.
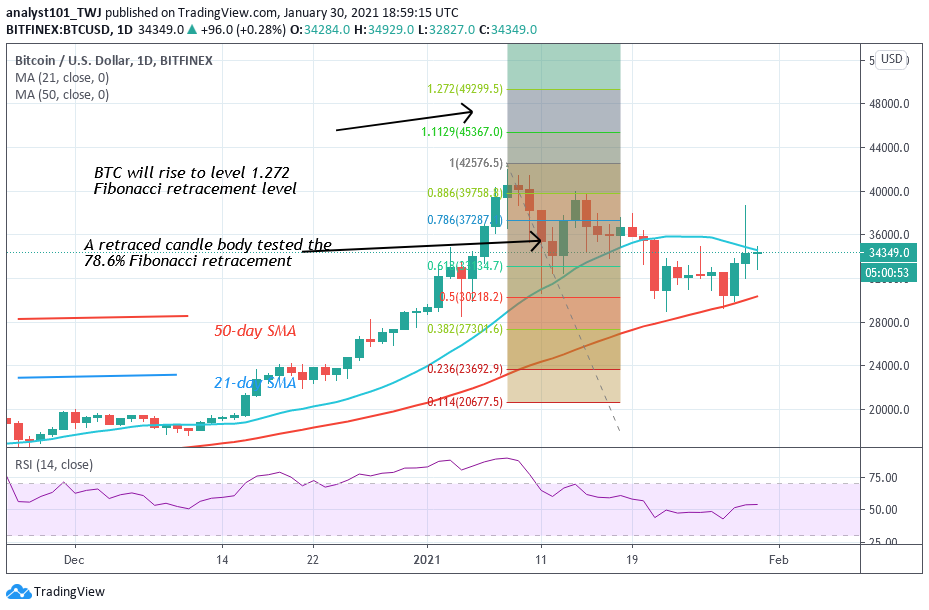
Today, buyers are struggling to sustain the price above the $34,000 resistance. Meanwhile, on January 11, a retraced candle body tested the 78.6% Fibonacci retracement level. The retracement indicates that BTC price will rise to level 1.272 Fibonacci extensions or the high of $49,299.50. Later, BTC price will reverse from the recent high to 78.6% Fibonacci retracement level.
ETH/USD Major Trend: Bullish
In the previous week, Ethereum bulls have been struggling to retest the $1,440 resistance after Ether attained the peak price of $1,434. As a result of the resistance, the biggest altcoin has been fluctuating between $1,200 and $1,440. For the past three days, the price movement has been stable above $1,300 support. Since January 19, the bulls have retested the resistance level thrice but unable to break it. On the upside, if the price breaks the $1,440 resistance, Ether will attain a new target price of $1,675.
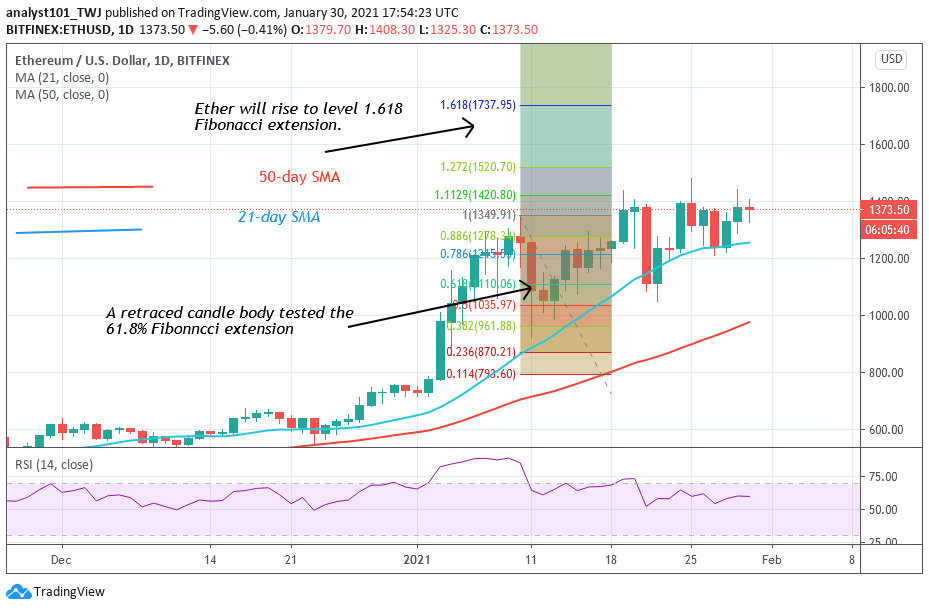
On the other, we expect the market to continue to fluctuate between $1,200 and $1,440 if the bullish scenario failed. The Fibonacci tool is likely to hold once the resistance at $1,440 is breached. On January 10 uptrend; a retraced candle body tested the 61.8% Fibonacci retracement level. This retracement indicates that ETH will rise to level 1.618 Fibonacci extensions or the high of $1,737.95.
XRP /USD Major Trend: Bearish
In the previous week, Ripple has been fluctuating between $0.25 and $0.31. There has been no significant price movement. The bulls have failed to cross over the $0.31 price level because of buying power. Today, XRP has encountered a breakout at the $0.31 resistance. The breakout was powerful as it rallied to the high of $0.516. However, it has gradually retraced to $0.40 low. The upward move could not continue because the Relative Strength Index has reached a high of 87.
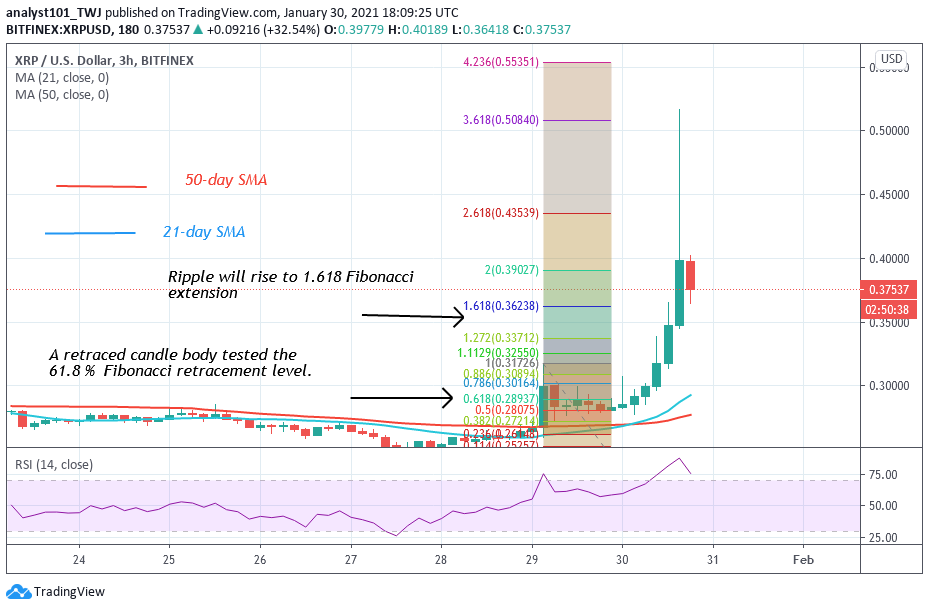
As bulls break the current resistance levels, there is the possibility of further upward movement. Meanwhile, on January 29 uptrend; a retraced candle body tested the 61.8% Fibonacci retracement level. The retracement implies that Ripple will rise to level 1.618 Fibonacci extension or $0.362 high. The recent rally surpassed that level but pulled back to the Fibonacci level. This week there is the possibility of further upside momentum.
BCH /USD Major Trend: Bullish
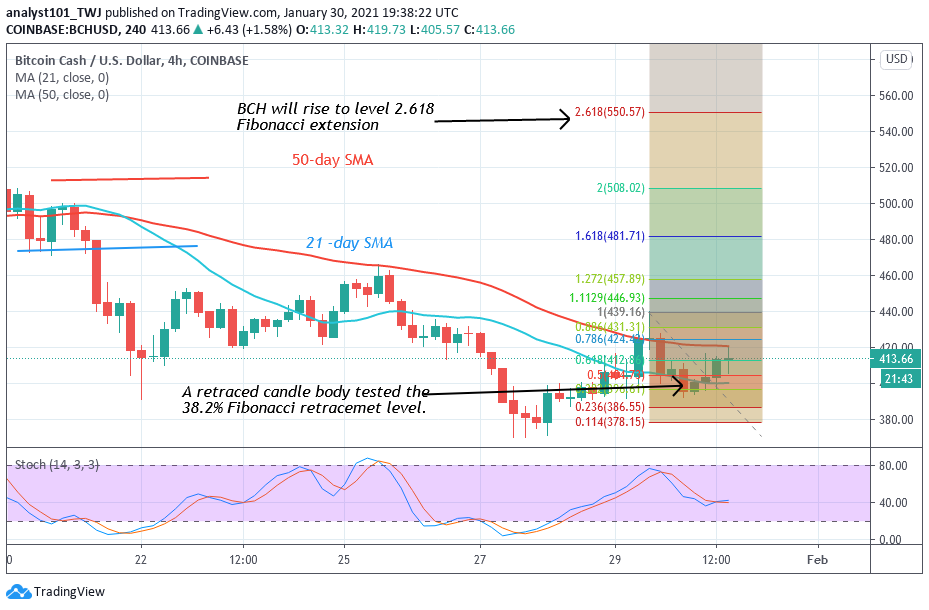
Bitcoin Cash has been on a downward move after its rejection from the $540 resistance. In the previous week, the altcoin fell to $391 and resumed range bound movement between $430 and $470. The downtrend resumed after the coin faced another rejection at $460. BCH dropped to $370 low and rebounded. The bulls ‘buy the dips’ to push the altcoin upward. Presently, the bulls are struggling to break above the $430 high. This week, the Fibonacci tool has indicated a possible upward move of the coin. On January 29 uptrend; the retraced candle body tested the 38.2% Fibonacci retracement level. The retracement indicates that BCH is likely to rise to level 2.618 Fibonacci extensions. In other words, BCH will rise to a high of $550.57.


