
Bitcoin and the four altcoins are now trading in the bull market. Bitcoin bulls will have to clear the $40,000 to $42,451 resistance zones before resuming the second round of upside momentum. The altcoins are making impressive moves as the coins break out of the bearish trend zones.
BTC/USD Major Trend: Bullish
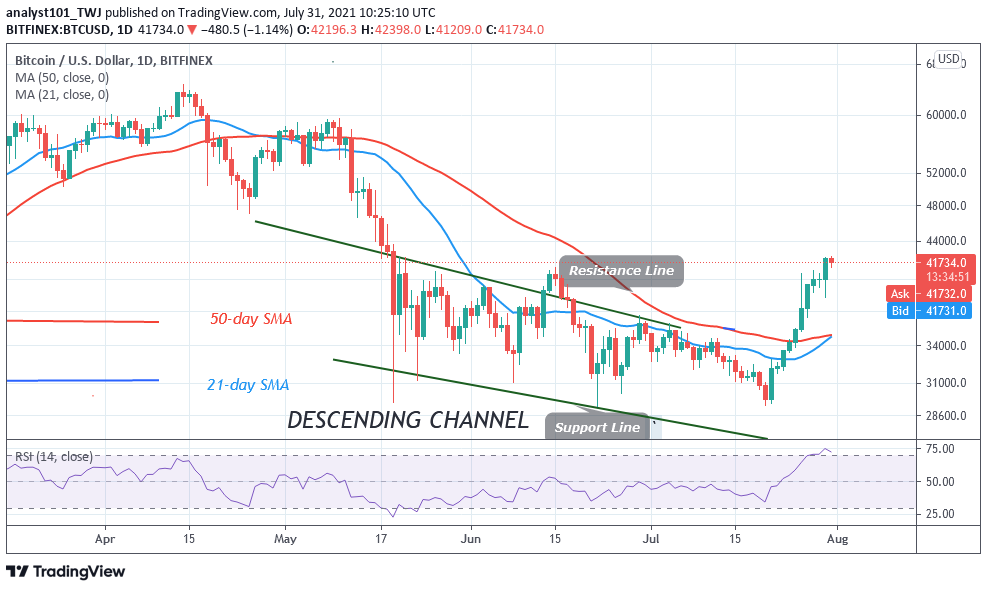
Since July 20, Bitcoin (BTC) plunged to $29,313 as bulls bought the dips. This has propelled BTC’s price to the upsides. Bitcoin bulls have cleared the resistance zones between $34,400 $35,000 as the crypto reached the high of $38,000. Nevertheless, after two days of correction, the bulls broke the $38,000 resistance and rallied above the $40,000 psychological price level. For the past week, the bulls have been having the upper hand. Yesterday, BTC price rallied to $42,299 high but upward move as was stalled. Today, crypto has been in a sideways move below a recent high.
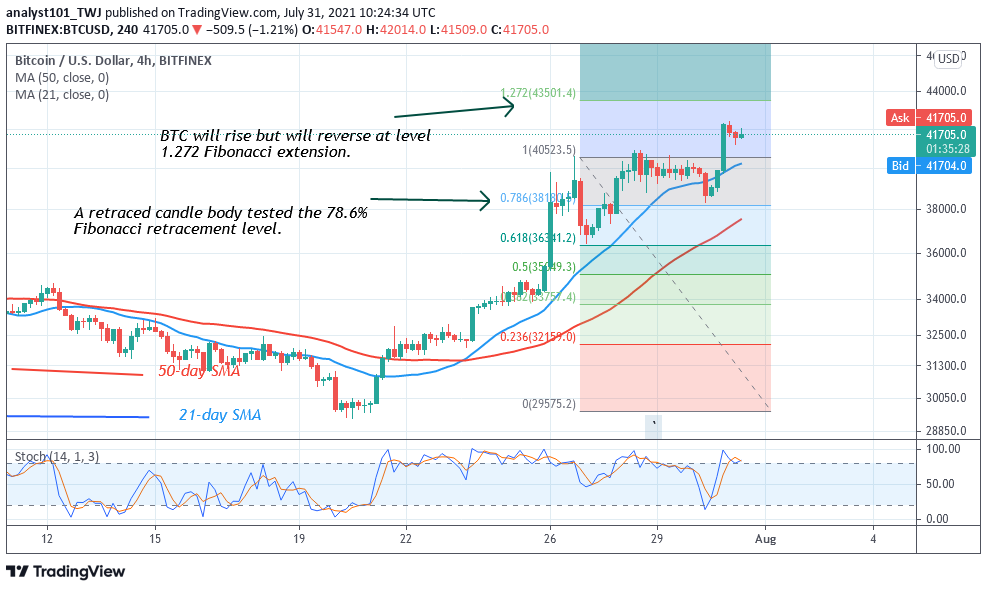
On the upside, if buyers clear the $40,000 to $42,451 resistance, Bitcoin will resume the second round of upside momentum. This will be an uphill task for buyers. Conversely, if buyers fail to push Bitcoin above the overhead resistance, BTC/USD will decline to $36,000 low. Meanwhile, on July 26 uptrend; a retraced candle body tested the 78.6% Fibonacci retracement level. The retracement indicates that Bitcoin will rise but will reverse to level 1.272 Fibonacci extension or level $43,501.40 where it originated. From the price action, the market is retracing after reaching the recent high. According to the RSI and the daily stochastic, Bitcoin has reached the overbought region of the market. In other words, Bitcoin will decline from the recent high if it faces rejection.
XRP/USD Major Trend: Bullish
Ripple’s (XRP) price is in a smooth uptrend. The altcoin rebounded above the previous low at $0.51. XRP price is making a series of higher highs and higher lows. On July 28, XRP made a higher high of $0.76 but the uptrend has been interrupted. XRP has resumed a sideways move below the recent high.
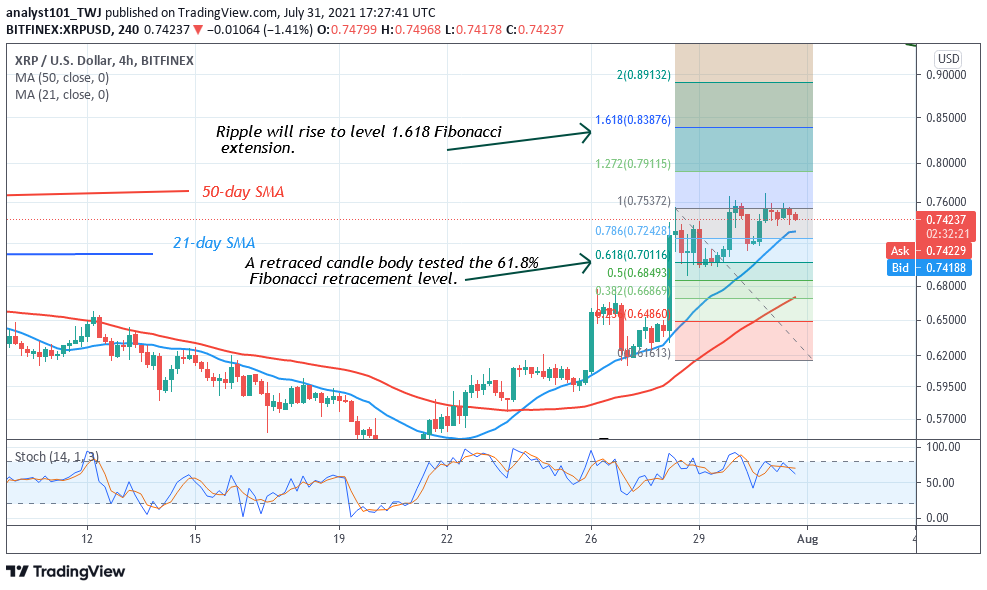
The market is fluctuating between $0.70 and $0.76 as buyers struggle to resume an uptrend. On the upside, if price breaks above $0.76 resistance, XRP/USD will rise to $0.85 high. Conversely, if price retraces and breaks below the previous low at $0.70, the market will decline to $0.62 low. Meanwhile, on July 28 uptrend; a retraced candle body tested the 61.8% Fibonacci retracement level. The retracement indicates that Ripple is likely to rise to level 1.618 Fibonacci extension or level $0.83.
DOT/USD Major Trend: Bullish
Polkadot’s (DOT) price rebounded as the altcoin reached the high of $16.47. In the previous price action, the uptrend was repelled at the $15.24 high. After two days of correction, the bulls broke the resistance at $15.24. On the upside, if buyers breach the $15.24 high, the market will rise to $17 high.
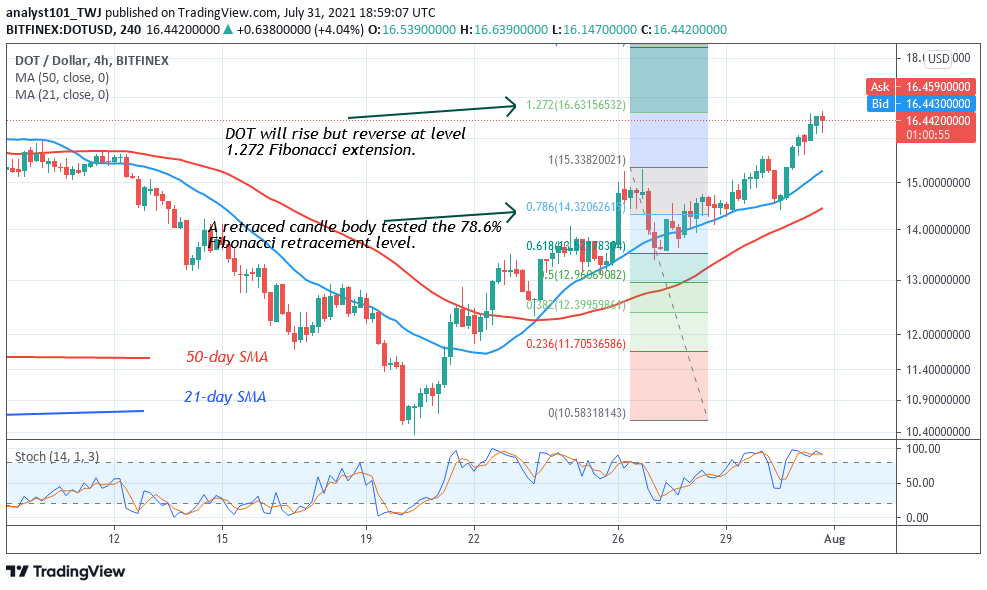
On the other hand, if the DOT/USD faces rejection, the DOT price will continue to fluctuate between $13 and $15.24. Meanwhile, on July 26 uptrend; a retraced candle body tested the 78.6% Fibonacci retracement level. The retracement indicates that the DOT price will rise but reverse at level 1.272 Fibonacci extensions or level $16.63. From the price action, the crypto is testing the 1.272 Fibonacci extension for a possible reversal. The daily stochastic is above the 80% range. This indicates that the market has reached the overbought region. Sellers will emerge to push prices down
LTC /USD Major Trend: Bearish
The recent Litecoin (LTC) upward move has propelled the coin to reach the bullish trend zone. In the first uptrend, the crypto rallied to $140 high and was repelled. After two days of correction, the bulls breached the $140 high as the market rallied to $145. On the upside, Litecoin will rise to the next resistance at $180, if the $140 price level is breached.
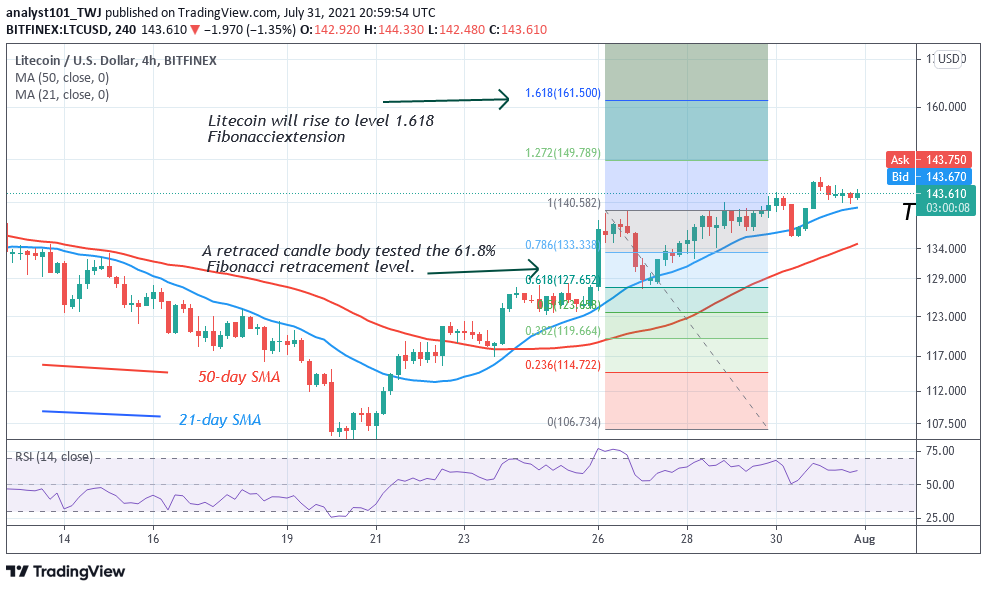
On the other hand, if Litecoin faces rejection at the $140 high, the market is likely to decline to the low of $107. Meanwhile, on July 26 uptrend; a retraced candle body tested the 61.8% Fibonacci retracement level. The retracement indicates that Litecoin is likely to rise to level 1.618 Fibonacci extension or level $161.50. From the price action, the crypto has reached a high of $144.
LINK /USD Major Trend: Bullish
For the past week, Chainlink has made a remarkable move as price breaks above the moving averages. The crypto has reached the high of $22 after breaking the $19 resistance. The uptrend is facing resistance at the recent high as the market reaches the overbought region. The uptrend will resume if it retraces to the support above the 21-day SMA.
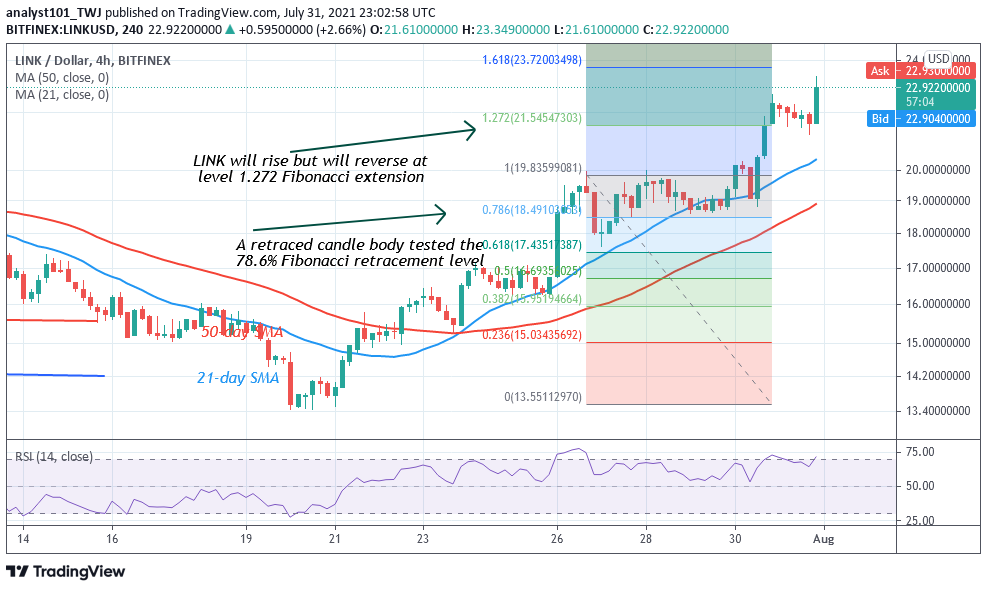
However, the price indicators have indicated that the crypto has reached the overbought region of the market. Further upside is unlikely as the crypto may face rejection at the recent high. Conversely, the overbought condition may not hold in a strong trending market. Meanwhile, on July 26 uptrend; a retraced candle body tested the 78.6% Fibonacci retracement level. This retracement indicates that the market will rise to level 1.272 Fibonacci extensions or level $21.54. From the price action, the altcoin makes a minor retracement to resume an uptrend.


