
Bitcoin and the altcoins are still in a downward correction as buyers fail to keep prices above the moving averages, hence the downward correction. Upside momentum will resume when price breaks above the moving averages. Let us discuss some of these altcoins.
BTC/USD Major Trend: Bearish
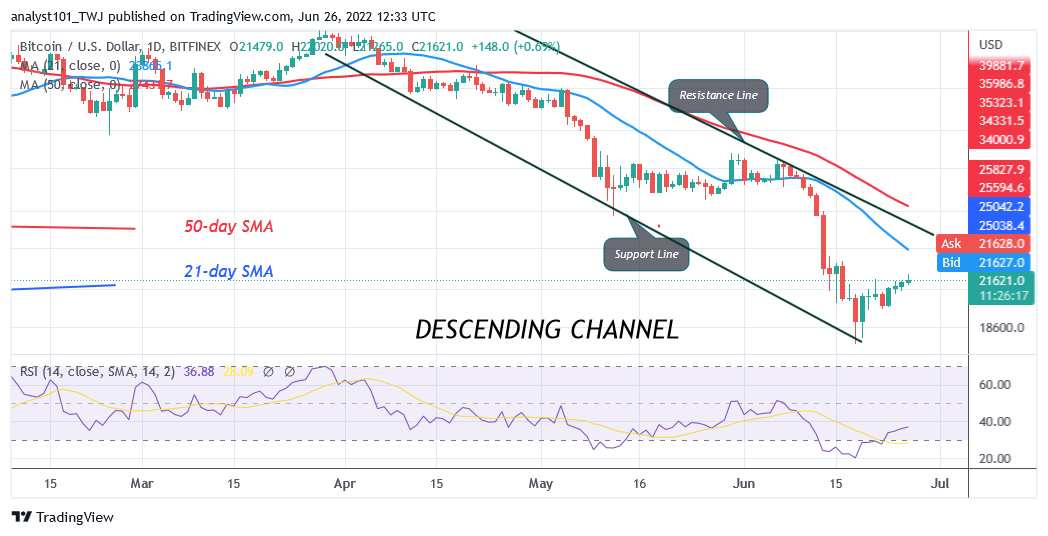
Bitcoin’s (BTC) price is in a downtrend but the largest cryptocurrency trades above the $20,000 psychological price level. Nevertheless, since June 18 price slump, the bulls bought the dips but have failed to break the recent high. To regain the bullish momentum, buyers have to keep BTC prices above the $21,675 and $23010 price levels. Today, Bitcoin is facing rejection as it retests the $22,000 resistance zone. The implication is that the BTC price will decline and find support above $20,000 support.
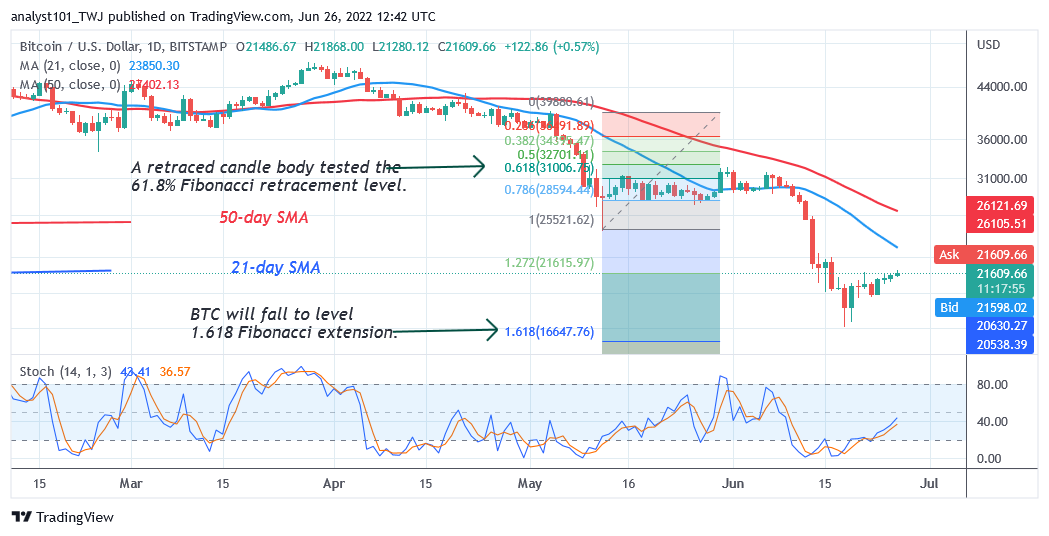
The downtrend will resume when the bears break below the $20,000 support. Bitcoin will decline and revisit the low of $17,605. Conversely, if the bulls break the $22,000 resistance level, the crypto will rally to the next resistance at the $23,010 high. Meanwhile, on May 12 downtrend; a retraced candle body tested the 61.8% Fibonacci retracement level. The retracement indicates that BTC will fall but will reverse at level 1.272 Fibonacci extension or $16,647.17. From the price action, Bitcoin has retested the current low and corrected upward.
SAND/USD Major Trend: Bearish
The Sandbox (SAND) price is in a downward correction as price breaks above the moving averages. However, the bulls could not sustain the bullish momentum above the moving averages.
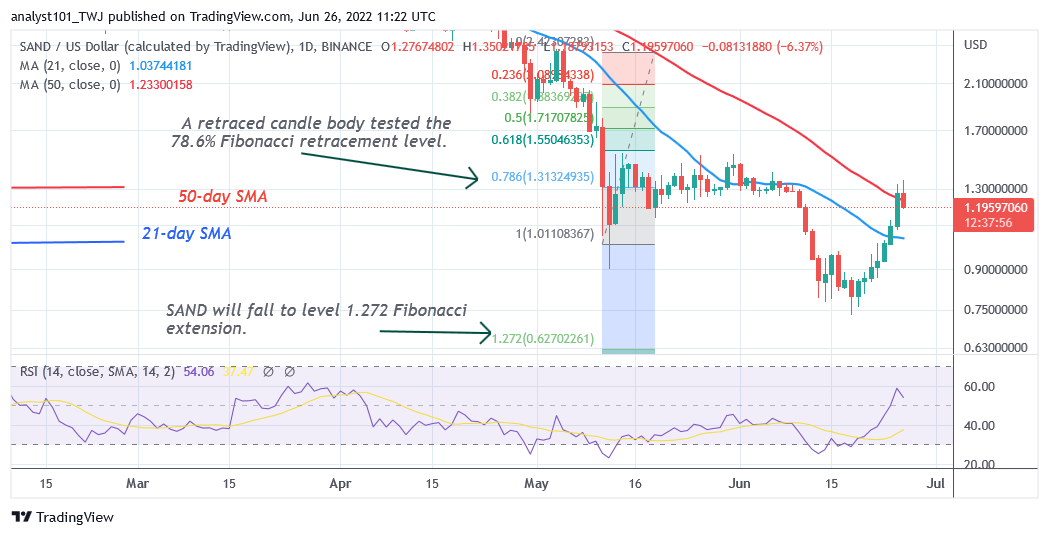
The cryptocurrency is declining below the 50-day line SMA. The Sandbox will be compelled to a range-bound move if it retraces and finds support above the 21-day line SMA. The downtrend will resume if price breaks below the 21-day line SMA. Presently, the downtrend has eased as price breaks above the moving averages. Meanwhile, the crypto is trading at $1.19 at the time of writing.
MANA/USD Major Trend: Bearish
Decentraland (MANA) price is in a downtrend as it breaks above the moving averages. The upward correction is facing rejection at the $1.00 resistance zone.
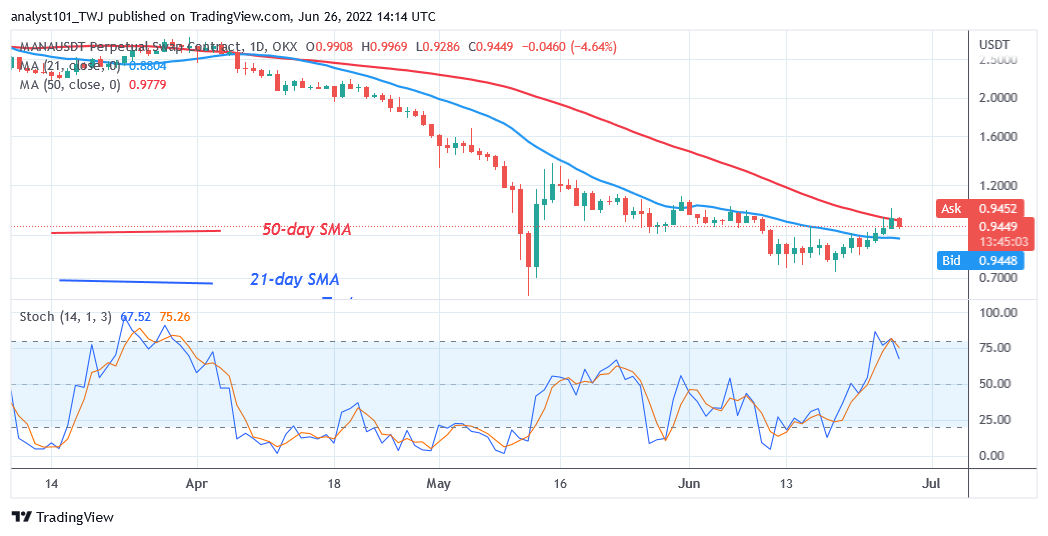
The bulls could not sustain the bullish momentum above the moving averages, hence the decline. The crypto is finding support above the 21-day line SMA indicating a possible range-bound move between the moving averages. The downtrend will resume if price breaks below the 21-day line SMA. It is below the 80% range of the daily stochastic. MANA is in a bearish momentum.
APE /USD Major Trend: Bearish
ApeCoin’s (Ape) price is in a downtrend but it is making an upward correction. The crypto has broken above the 21-day line SMA. A break above the 50-day line SMA will signal the resumption of the uptrend.
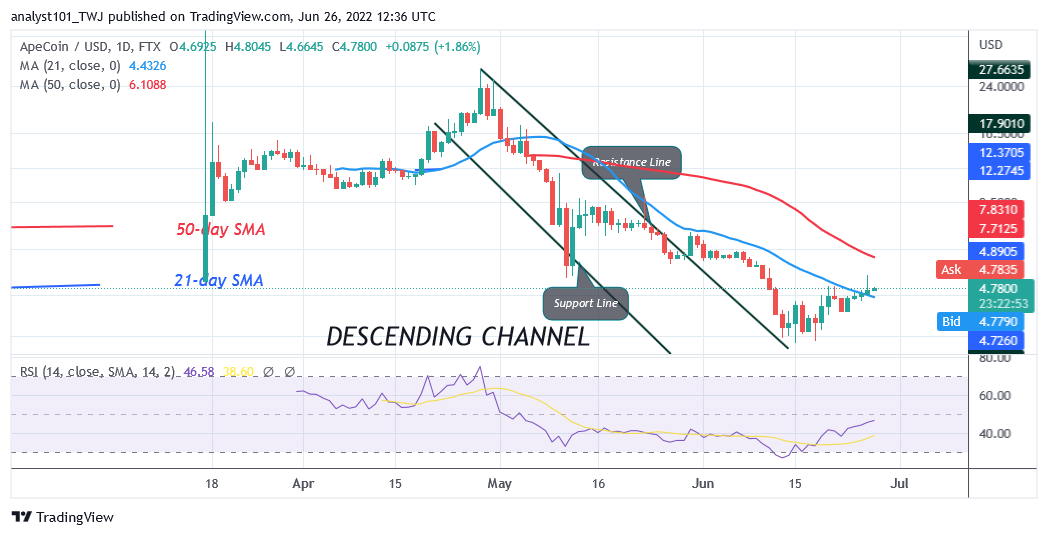
The cryptocurrency will rise and revisit the previous highs of $6 and $12. However, if the coin turns from the 50-day line SMA, the altcoin will decline and become range-bound between the moving averages. The coin is at level 46 of the Relative Strength Index for period 14. It indicates that it is in the downtrend zone but approaches the bullish trend zone.
ENJ /USD Major Trend: Bearish
Enjin Coin (ENJ) is in a downtrend but has resumed a sideways move between the moving average lines. On the upside, if price breaks above the 50-day line SMA, it will signal the resumption of the uptrend. The downtrend will resume if the bears break below the 21-day line SMA.
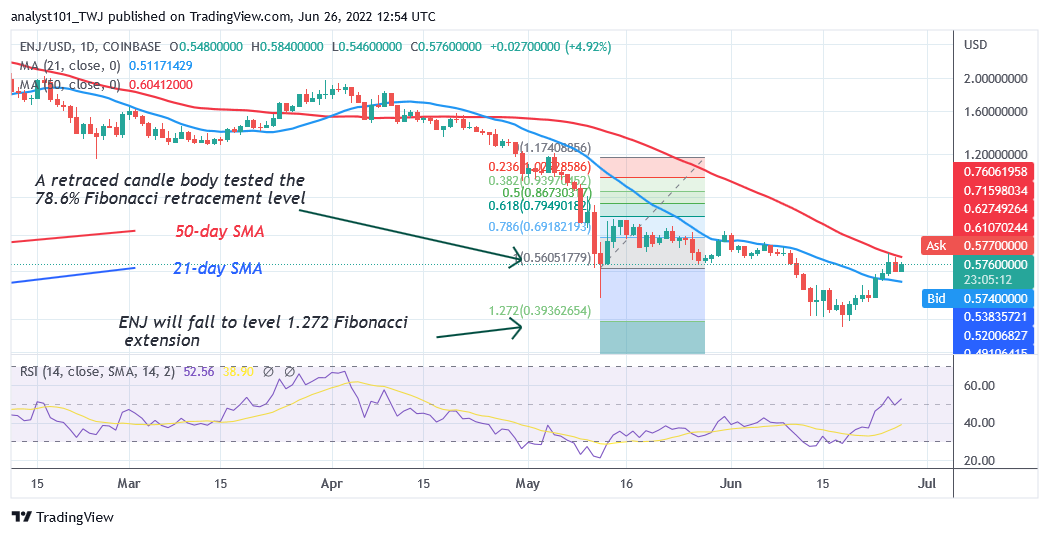
The coin is at level 52 of the Relative Strength Index for period 14. It indicates that the cryptocurrency is in the uptrend zone and capable of a further upward move. Meanwhile, on May 12 downtrend, a retraced candle body tested the 78.6% Fibonacci retracement level. The retracement indicates that ENJ will fall to level 1.272 Fibonacci extension or $0.39. From the price action, the coin has retested the 1.272 Fibonacci extensions and resumed upward


