

Bitcoin bulls have broken above the $58,000 high as BTC hit the psychological price level of $60.000. Perhaps, this will signal the resumption of upside momentum.
It is becoming customary for Bitcoin to have occasional drawdowns, each time BTC attains a new high. Ether, XRP, and BCH are making positive moves to break the next resistance levels.
BTC/USD Major Trend: Bullish
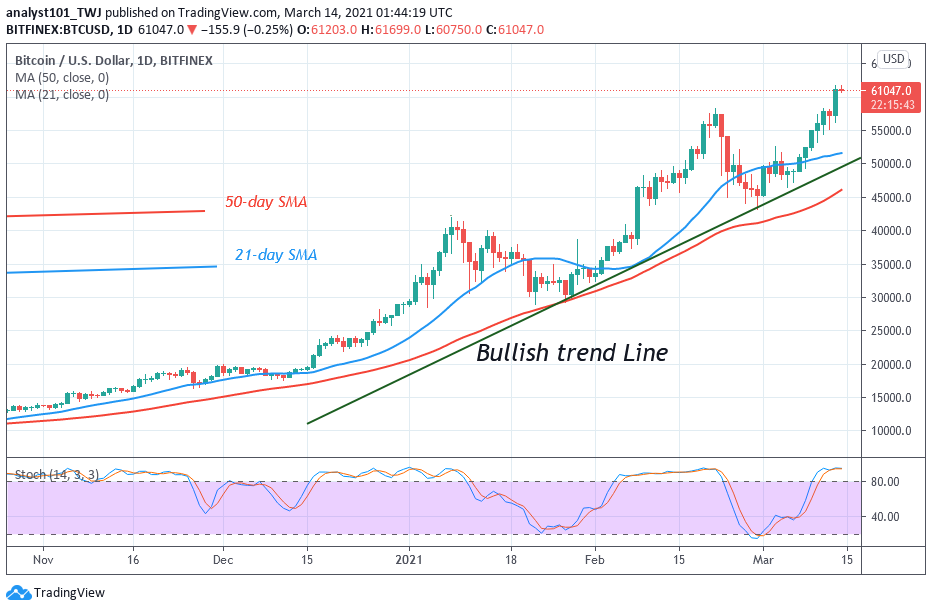
In the previous week, BTC price broke the $52,000 resistance and it rallied to $58,000 high. As buyers pushed the coin to the recent high there was a bearish reaction as price slumped to $55,000 low. Meanwhile, after three days of correction, the bulls broke the $58,000 overhead resistance. The breaking of this resistance level has paved the way for upside momentum. Today, the coin has rallied above $60,000. The price indicator has shown a possible target price of $61,540.40.
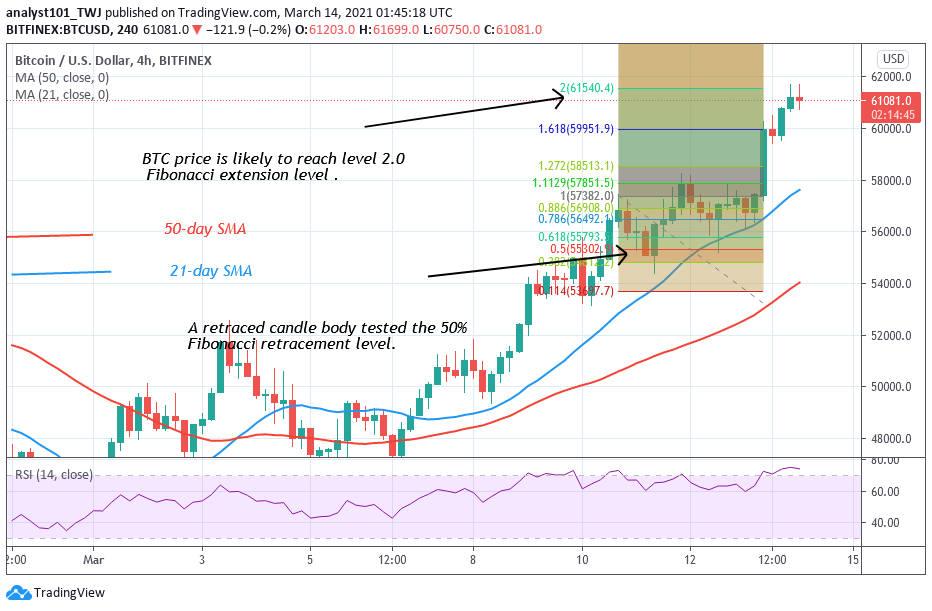
Analysts believe that Bitcoin has enough room to rally on the upside. This week the price is expected to reach the high of $72,000. On March 10 uptrend; a retraced candle body tested the 50% Fibonacci retracement level. The retracement indicates that BTC price will rise to level 2.0 Fibonacci extension or the high of $61,540.40. The price action has confirmed this level. BTC price is likely to resume upside momentum.
ETH/USD Major Trend: Bullish
Last week, Ethereum was in a downward correction as the crypto was in a sideways move below the $1,600 resistance. The coin was fluctuating between $1,300 and $1,600. After three days of correction, the bulls broke the $1,600 resistance. The price rallied to $1.879 high and was resisted. The bulls could not sustain the bullish momentum above $1,800. Traders believe that if price breaks above $1,800 resistance, a rally to $2,000 is likely. Today, the price breaks above the resistance level and rebounded above $1,800 support. Ethereum is retesting the $2,000 overhead resistance zone to break above it.
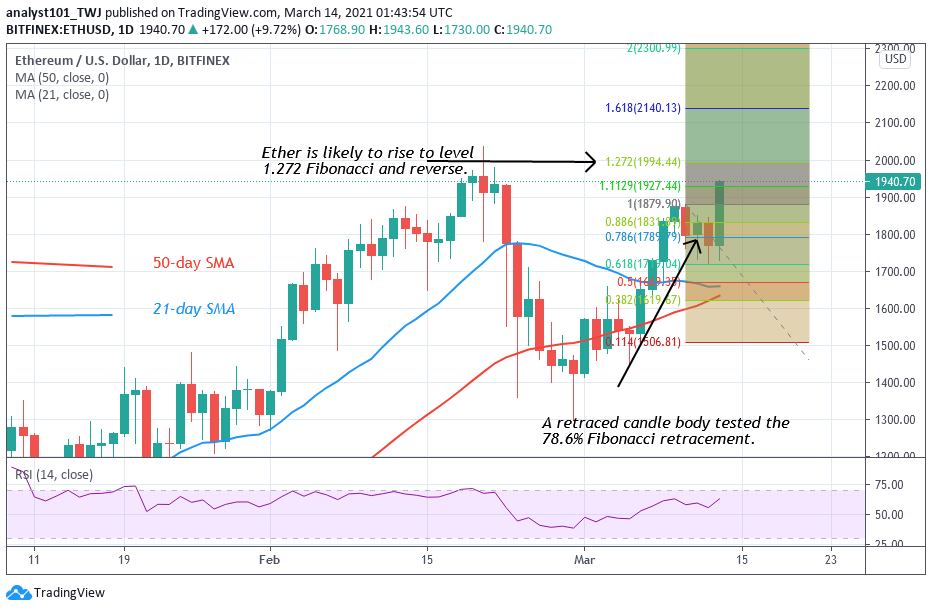
Meanwhile, the biggest altcoin is trading at $1.907 at the time of writing. Nevertheless, the Fibonacci tool has indicated an upward movement of the coin. On March 9 uptrend; a retraced candle body tested the 78.2% Fibonacci retracement level. This retracement implies that ETH will rise to level 1.272 Fibonacci extension or the high of $1,994.44. Ether will reach this high but will reverse and return to level 78.6% Fibonacci extension where it originated.
XRP /USD Major Trend: Bearish
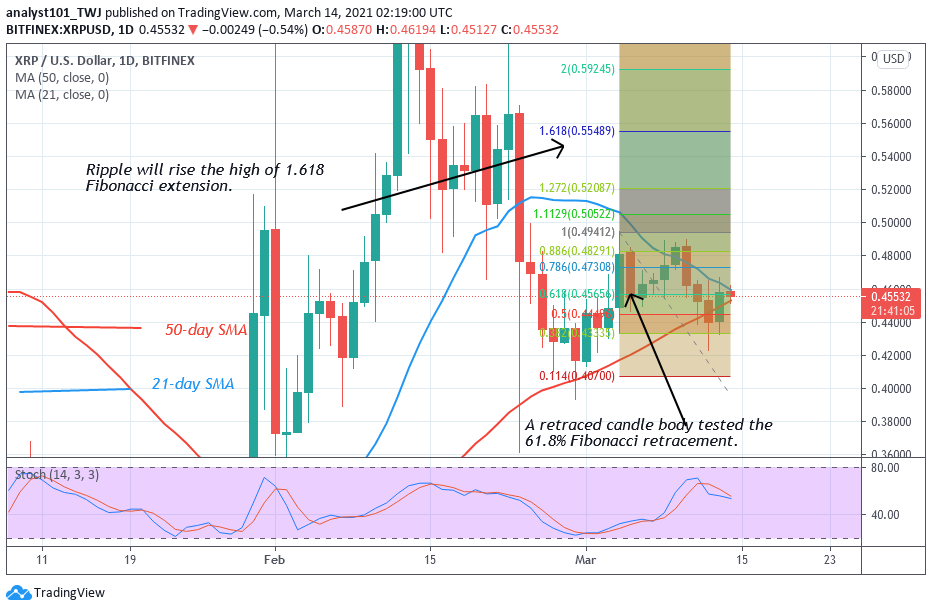
For the past week, XRP has been consolidating above the $0.44 support, Buyers pushed the price to $0.48 high. The bulls could not sustain the bullish momentum above the recent high. On March 10, the crypto was facing a bearish reaction as the coin declined to $0.42 low. The bulls buy the dips to resume upward movement. Meanwhile, on March 4 uptrend; a retraced candle body tested the 61.8% Fibonacci retracement level. The retracement indicates that Ripple will rise to level 1.618 Fibonacci extension or the high of $0.55.
BCH /USD Major Trend: Bullish
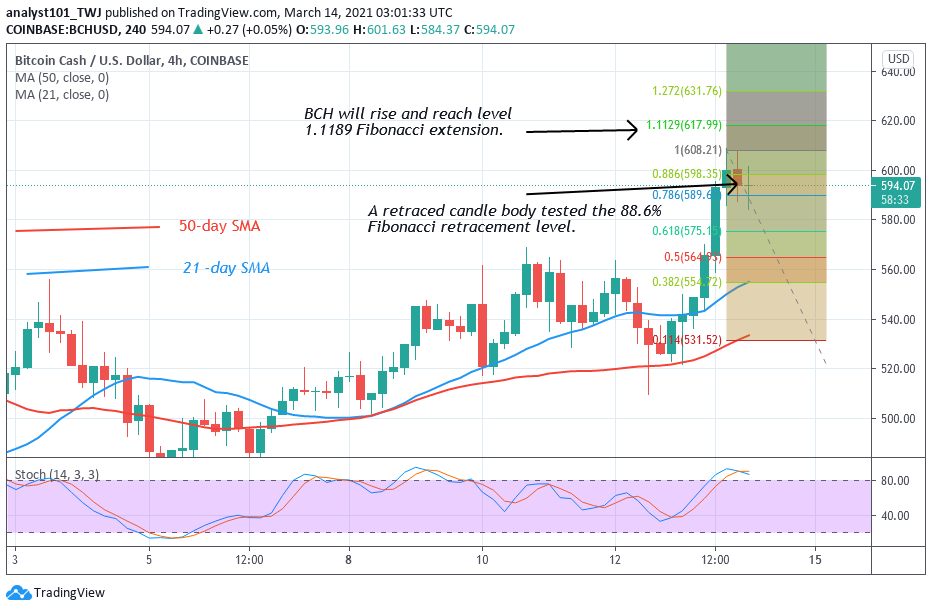
In the previous week, BCH has been fluctuating between $440 and $560 price levels. On March 1, the price movement was confined between $500 and $560. The coin was consolidating near the resistance level. On the upside, the chances of a breakout are increased when the price consolidates near a resistance level. A breakout will compel BCH to rally to $620 and $720 high. On March 13, the coin was resisted as price declined to $525 low. Yesterday, the altcoin rebounded above $520 to break the recent high. The price is approaching the high of $600. There is a possibility of a further upward move. On March 13 uptrend; a retraced candle body tested the 88.6% Fibonacci retracement level. The retracement indicates that BCH is likely to rise to level 1.1129 Fibonacci extensions or the high of $617.19.


