

Bitcoin has been range-bound between $44,000 and $52,000 price levels for the past week. Bitcoin bulls are finding penetration difficult at the $52,000 resistance. A breakout above $52,000 resistance will signal the resumption of upside momentum. Ethereum and other altcoins are in a downward correction. There is a tendency for price upward movement, this week.
BTC/USD Major Trend: Bullish
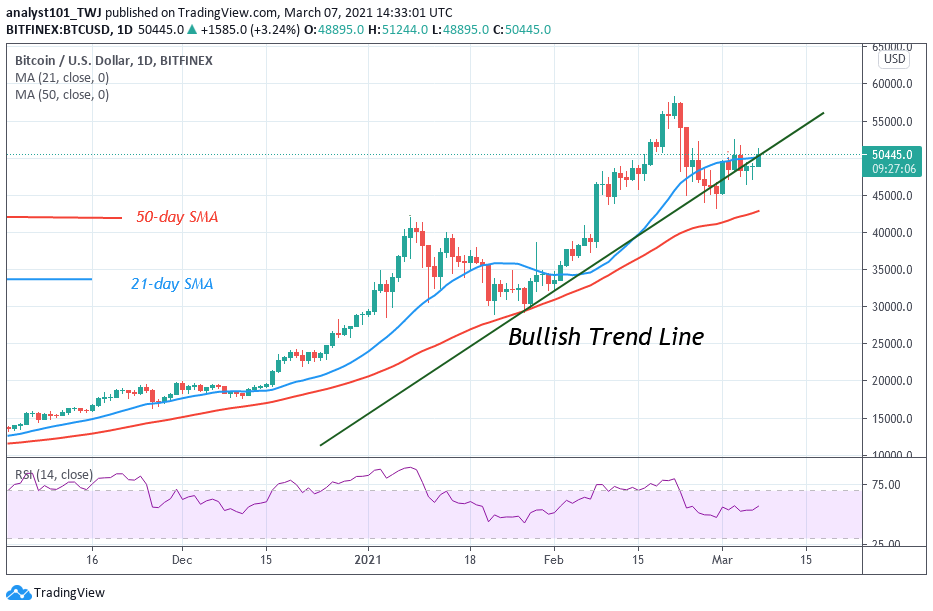
Bitcoin bulls have been battling to break the $52,000 resistance since February 23 breakdown. For the past week, the king coin has been range-bound between $44,000 and $52,000. On March 3, the BTC price rallied to $52,000 high but could sustain the uptrend. On the upside, if the uptrend has been sustained above $52,000 high, the $58,000 overhead resistance would have been retested or broken. In other words, the upside momentum would have resumed. However, as Bitcoin turned back from the recent high, the range-bound movement will resume. Today, BTC price is making positive moves as bulls break the $50,000 psychological price level. The bulls are targeting to breach the $52,000 resistance. If the bulls are successful, the upside momentum will resume. The range-bound move will resume move if bulls fail to sustain the uptrend.
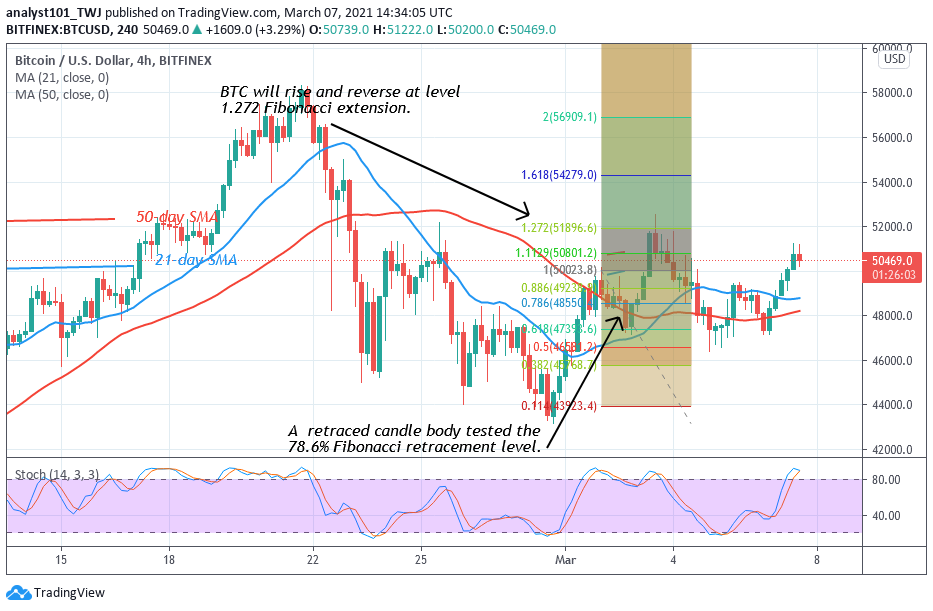
On March 2 uptrend; a retraced candle body tested the 78.6% Fibonacci retracement level. The retracement indicates that BTC price will rise and reverse at level 1.272 Fibonacci extensions or the high of $51,896.60. On March 3, the BTC price reverses from the recent high and fell to the previous low. This week the $52,000 is likely to be breached.
ETH/USD Major Trend: Bullish
For the past week, Ethereum has been range-bound between $1,300 and $1,600 after rejection from $1,700 on February 24. Since March 1, the biggest altcoin has been confined to trade between $1,300 and $1,600. In the last three days, the price action has been characterized by small body candlesticks called Doji and Spinning tops. In other words, the biggest altcoin is consolidating in the current tight range. . In such a period, a breakout or breakdown cannot be ruled out. Today, Ether rebounded above the current support as price breaks the resistance at $1,600.
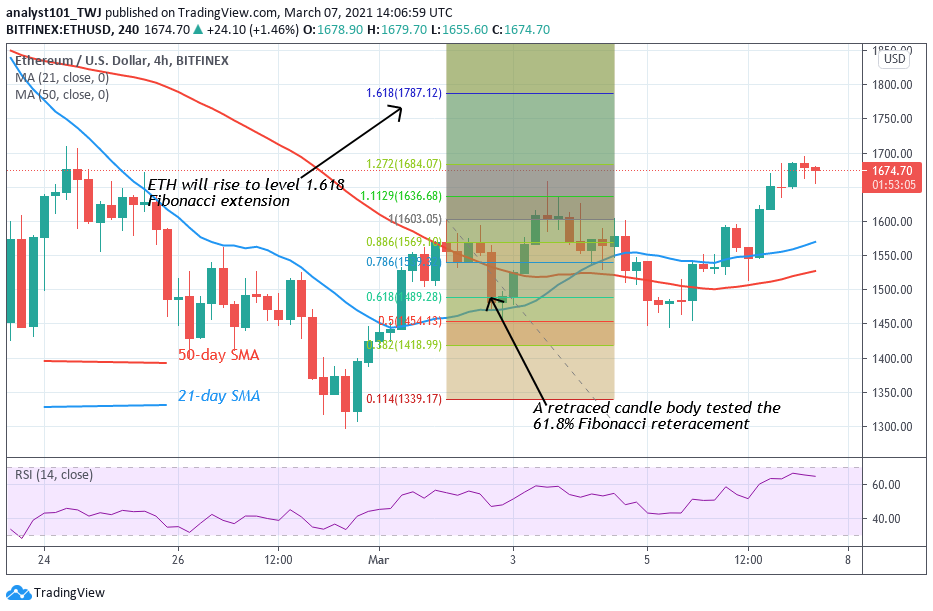
The brief uptrend has been repelled at $1,700. If the bulls have broken the recent high, a retest at $2,000 high is likely. Nonetheless, the Fibonacci tool has indicated a further upward movement of the coin. On March 2 uptrend; a retraced candle body tested the 61.8% Fibonacci retracement level. This retracement implies that ETH will rise to level 1.618 Fibonacci extension or the high of $1.787.12.
XRP /USD Major Trend: Bearish
In the previous week, XRP has been trading in a confined range between $0.40 and $0.45 after the breakdown on February 23. However, the bulls broke the price range as XRP price rallied to $0.50 high. Buyers were unable to sustain the uptrend above the $0.50 high as the bears pushed the price to the previous price range. Today, the crypto’s price has resumed bullish momentum as price reaches a high of $0.46. On the upside, if the bulls break the $0.50 resistance, XRP will rally to a $0.65 high.
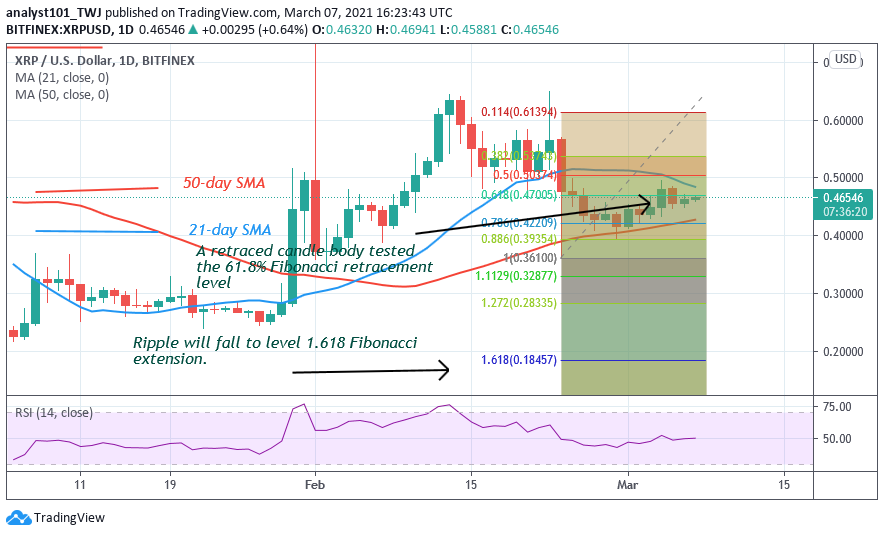
Nevertheless, if Ripple faces rejection in the current uptrend, the selling pressure will resume. On February 23 downtrend; the retraced candle body tested the 61.8% Fibonacci retracement level. The retracement indicates that XRP is likely to fall to level 1.618 Fibonacci extensions. In other words, XRP will fall to a low of $0.18
BCH /USD Major Trend: Bearish
Presently, Bitcoin Cash is fluctuating between the $440 and $560 price levels. For the past week, the price corrected upward to $560 high. However, the bulls could not sustain the uptrend above the recent high. Each attempt at the resistance will compel the coin to fall to the previous lows. In the meantime, BCH is trading in a confined range. On the downside, if the bears break below the $440 support, BCH will decline to $360 low. On the upside, if the bulls break the recent high, BCH will rally to $720 high.
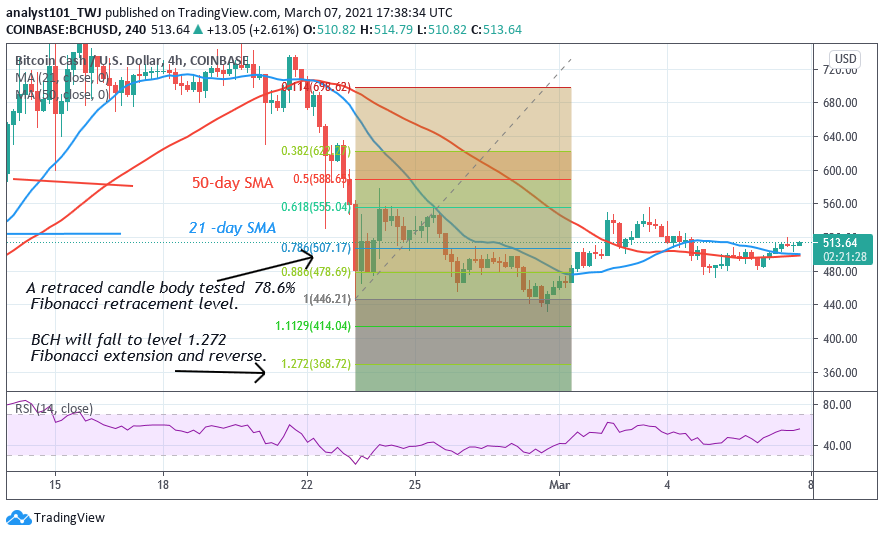
Meanwhile, the Fibonacci tool has indicated a downward movement of the coin if the current support at $440 is breached. Nevertheless, on February 27 downtrend; the retraced candle body tested the 78.6% Fibonacci retracement level. The retracement indicates that BCH will reverse at level 1.272 Fibonacci extensions or the low of $393.75. Bitcoin Cash is expected to reverse at this present low to the 78.6% Fibonacci retracement level where it originated.


