
Bitcoin price has made impressive moves as bulls have one more step into the bullish trend zone. Bitcoin will resume upside momentum once it reclaims the $58,000 support level. Polkadot and Chainlink will have a marginal upward move but will reverse on the downside. Litecioin is in an impressive bullish move as the altcoin targets the $600 high
BTC/USD Major Trend: Bullish
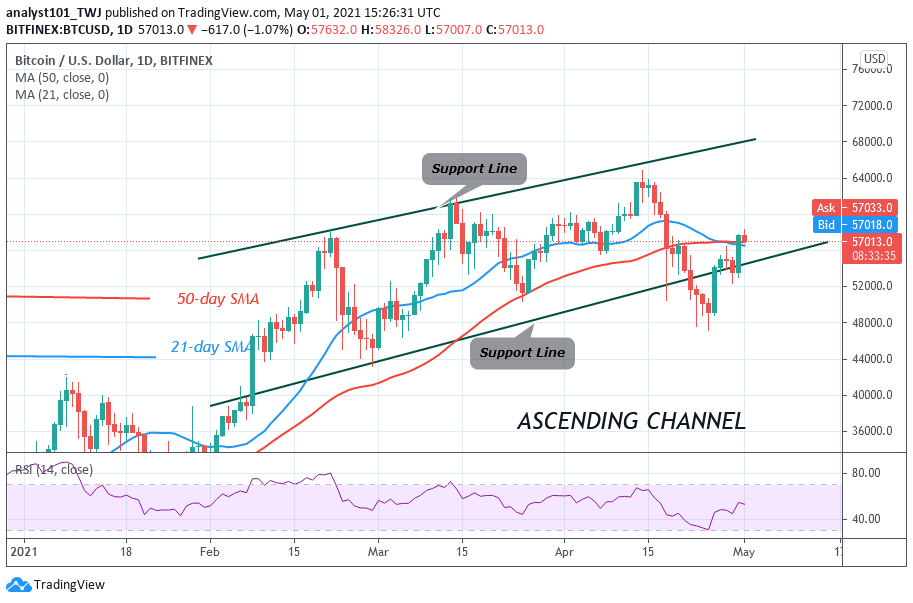
BTC/USD rebounded above the $54,000 support as the coin rallied to $58,000 high. Bitcoin has regained bullish momentum and a retest or breakout at this level is likely. Meanwhile, Bitcoin is retracing after rejection from the recent high. On the daily chart, the market is retracing above the support of the 21-day and 50-day SMAs. The king coin will resume an upward move if the current support holds. A breakout at the $58,000 resistance will propel BTC price to resume upside momentum. However, if price breaks below the SMAs, the selling pressure will resume.
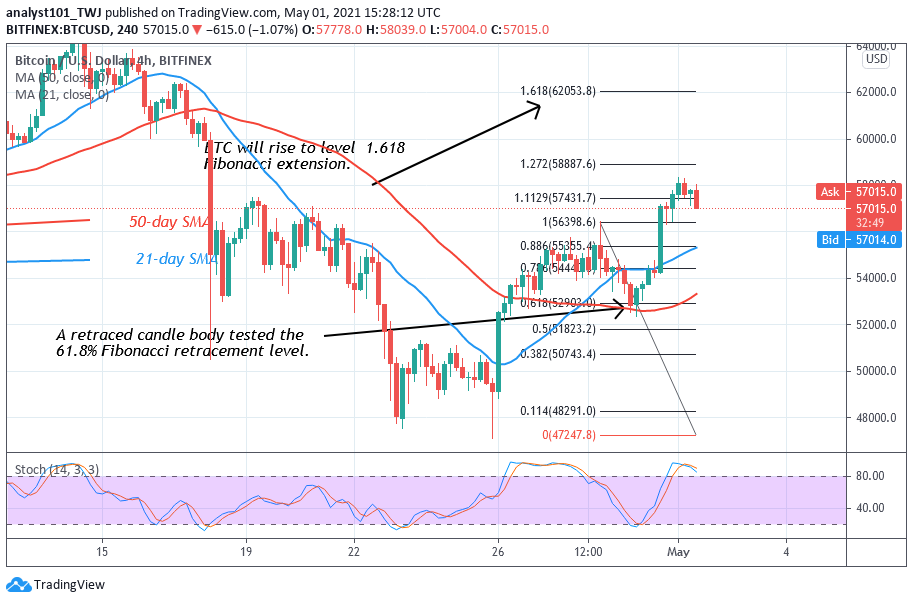
This week, BTC/USD is likely to move up according to the Fibonacci tool. On April 28 uptrend. a retraced candle body tested the 61.8% Fibonacci retracement. This indicates that the market will rise to level 1.618 Fibonacci extension or the high of $62053.80. Meanwhile, Bitcoin is trading at $57,241 at the time of writing.
DOT/USD Major Trend: Bearish
Polkadot’s (DOT) recent upward move is facing rejection at the $38 resistance zone. On April 25, the altcoin rebounded above the $28 support to resume the recent uptrend. In the previous price action, the altcoin plunged from the high of $48 to the low of $28. Since April 17, the altcoin has been in a downward correction, fluctuating between $28 and $40. DOT price is falling after reaching the high of $37. The altcoin price is retracing toward the support of the 21-day SMA.
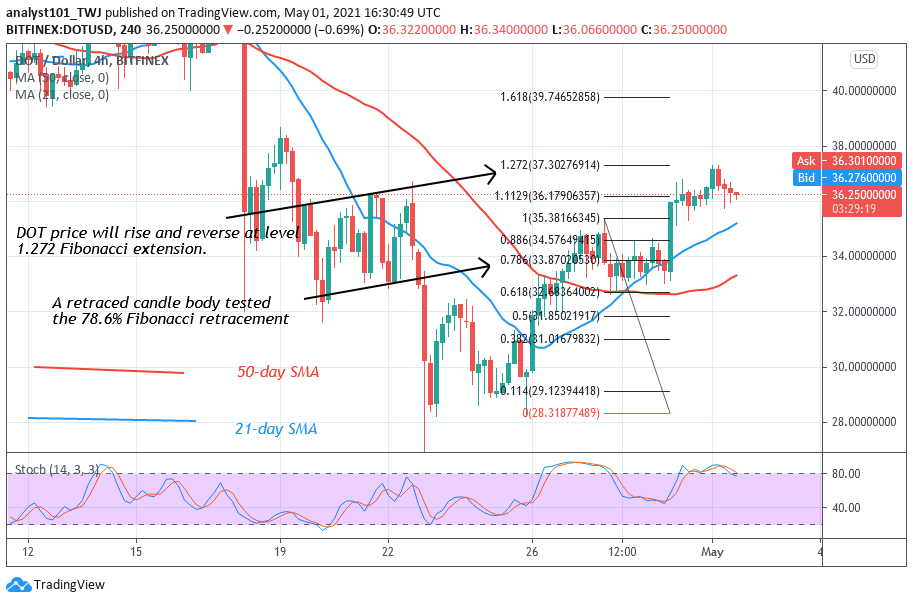
On April 27 uptrend, a retraced candle body tested the 78.6% Fibonacci retracement level. The retracement indicates that DOT price will rise and reverse at level 1.272 Fibonacci extension. Today, the market has already reached the 1.272 Fibonacci extensions and the DOT price is reversing from the recent high. The downtrend will extend to the low at the 78.6 Fibonacci retracement level. If price reaches the retracement level and breaks below the moving averages, the selling pressure will continue. On the other hand, if the altcoin finds support above the moving averages, the uptrend will resume upward.
LTC /USD Major Trend: Bullish
For the past week, Litecoin has been in an upward move. LTC price has reached a high of $274 but it is facing rejection at the recent high. The altcoin is retesting the $270 historical price level of January 2018. In 2018, the bulls were rejected and the altcoin resumed a downward move to the low of $40. On the upside, if the bulls breach the recent resistance, a retest at the $320 resistance is possible. Nonetheless, if the $320 overhead resistance is breached, the market will rally to a high of $600.
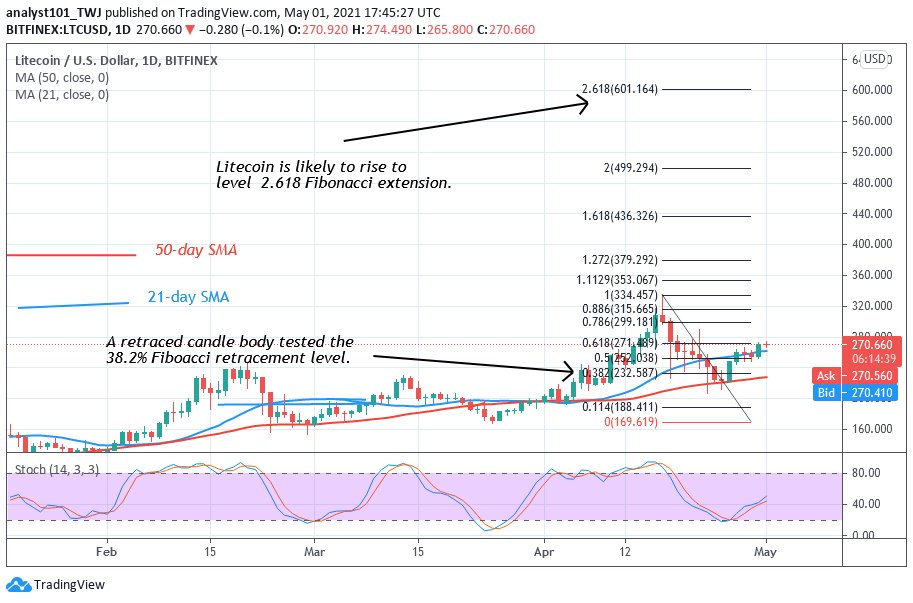
Meanwhile, on April 17 uptrend; a retraced candle body tested the 38.2% Fibonacci retracement level. The retracement gives the impression that Litecoin is likely to fall to level 2.618 Fibonacci extension or the high of $601.16. From the price action, LTC has resumed upward and the market is approaching a high of $272.57.
LINK /USD Major Trend: Bullish
Presently, Chainlink’s price is in an uptrend and it is attempting to revisit the previous highs of $40 and $44. Buyers were able to breach the $38 resistance as the market approaches the high $40. In previous price action, the bulls could not breach the $38 resistance. Buyers will retest the $44 overhead resistance if the bullish momentum is sustained.
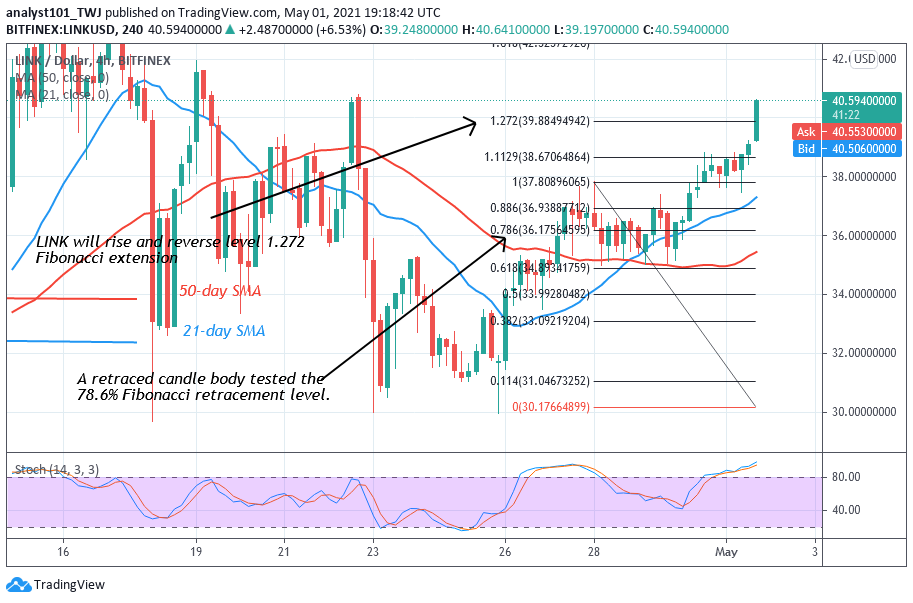
Conversely, if Chainlink faces rejection at the recent high, the market will decline to $35 low. Meanwhile, the Fibonacci tool has indicated a possible rise and subsequent reversal of price. On April 28 uptrend; a retraced candle body tested the 78.6% Fibonacci retracement level. This retracement indicates that LINK will rise and reverse at level 1.618 Fibonacci extension or the high of $39.88.


